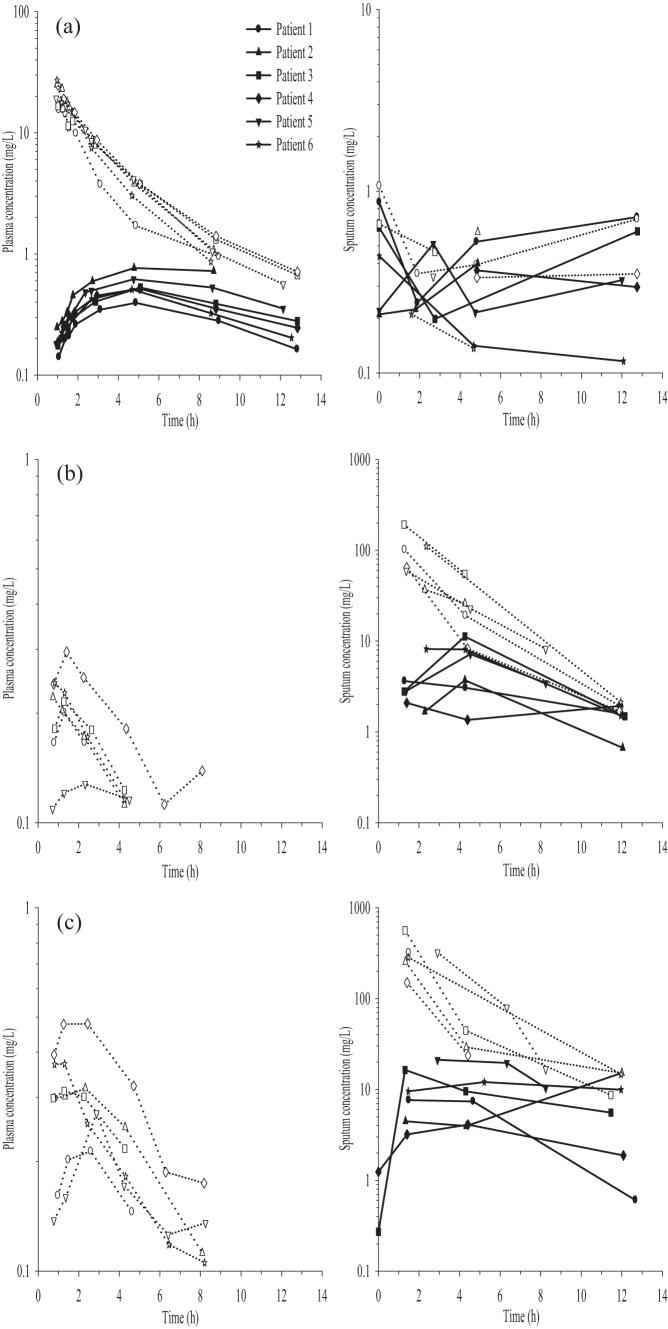
FIG 1.
Plasma (left panels) and sputum (right panels) concentration-versus-time profiles of CMS (open symbols) and formed colistin (closed symbols) for each patient following i.v. CMS dose of 150 mg CBA (a) and nebulized CMS doses of 2 million IU (b) and 4 million IU (c). Note the different range of concentrations on the y axis across the panels. The concentrations of CMS and colistin present in predose sputum samples for the nebulized 4 million IU dose (second treatment arm) and the i.v. dose (third treatment arm) are shown at time zero in the respective panels.

