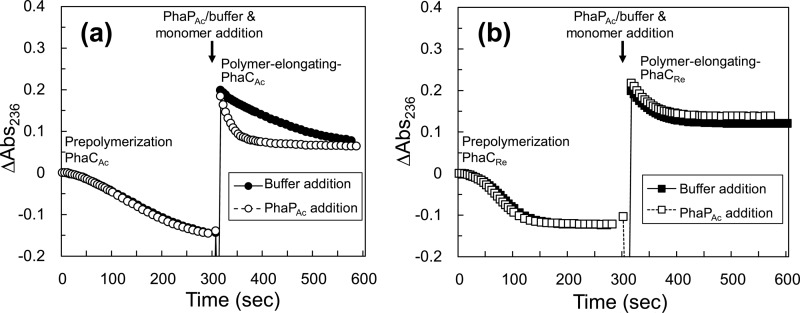
FIG 5.
Reaction progress curves obtained with 350 nM PhaCAc with a His tag (a) and 200 nM PhaCRe (b) during two-step addition of R-3HB-CoA. Reactions were initiated with 50 μM R-3HB-CoA, followed by the addition of PhaPAc (1 μM in final concentration) or buffer (control) and 50 μM R-3HB-CoA with a 300-s incubation.

