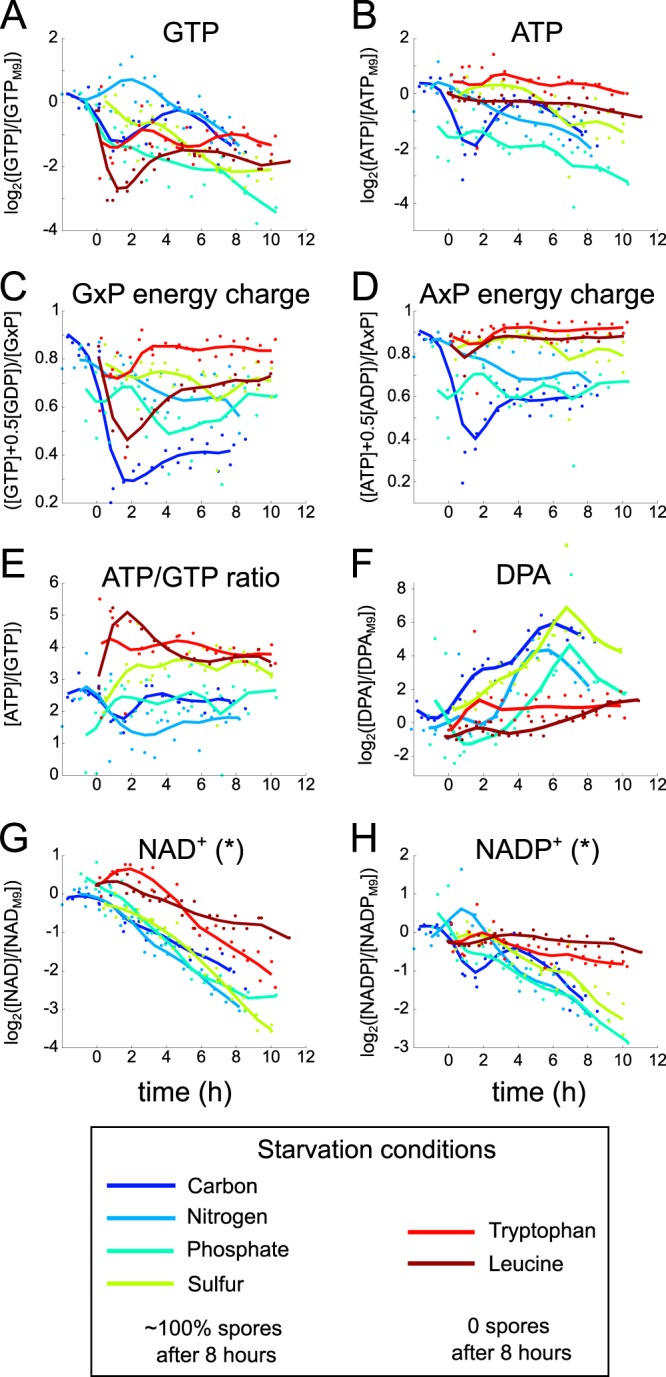
FIG 5.

Time courses of intracellular metabolite concentrations in B. subtilis. T = 0 corresponds approximately to the end of the exponential growth phase. Metabolite concentrations (A, B, and F to H) are given in log2 scale relative to the concentrations during exponential growth in M9 medium, while ratios (C to E) are given in absolute quantities. Dipicolinic acid (DPA) (F) is a major component of the spore coat, shown to demonstrate induction of sporulation. Lines are cubic spline fits. “*” indicates that the methods used in this work cannot accurately distinguish reduced and oxidized cofactor forms. While the best estimate of [NAD+] is shown, the observed decrease can be due to either a decrease in the total NAD(H) pool or a decrease in the NAD+/NADH ratio, and the same caveat applies to NADP+.
