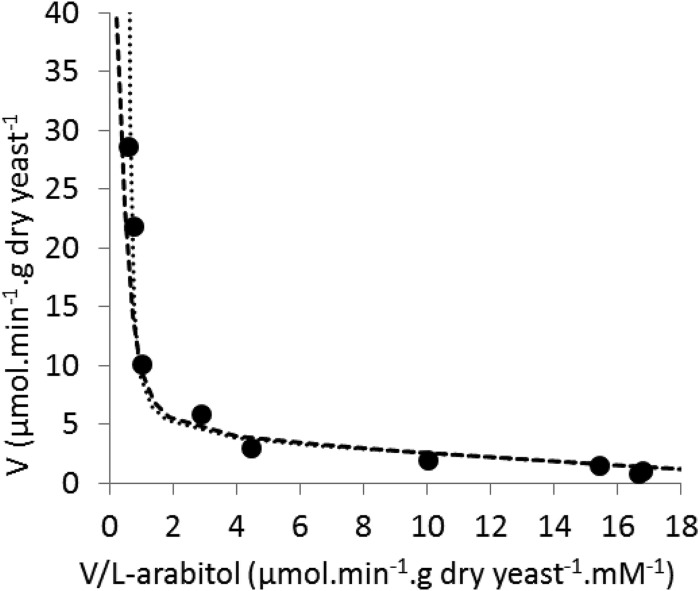
FIG 2.
Biphasic kinetics of l-arabitol transport into A. monospora. The initial transport rates (V) were measured between 0.05 and 50 mM l-arabitol. The Eadie-Hofstee plot shows experimental points (●) fitted by curves calculated for the sum of either two Michaelis-Menten systems, a high-affinity system with a Km of 0.16 mM and a Vmax of 3.9 μmol · min−1 · g (dry weight) yeast−1 plus a low-affinity system with a Km of 75 mM and a Vmax of 49 μmol · min−1 · g (dry weight) yeast−1 (dashed line) or the same high-affinity system plus a first-order system with a k of 0.55 μmol · min−1 · g (dry weight) yeast−1 · mM l-arabitol−1 (dotted line).

