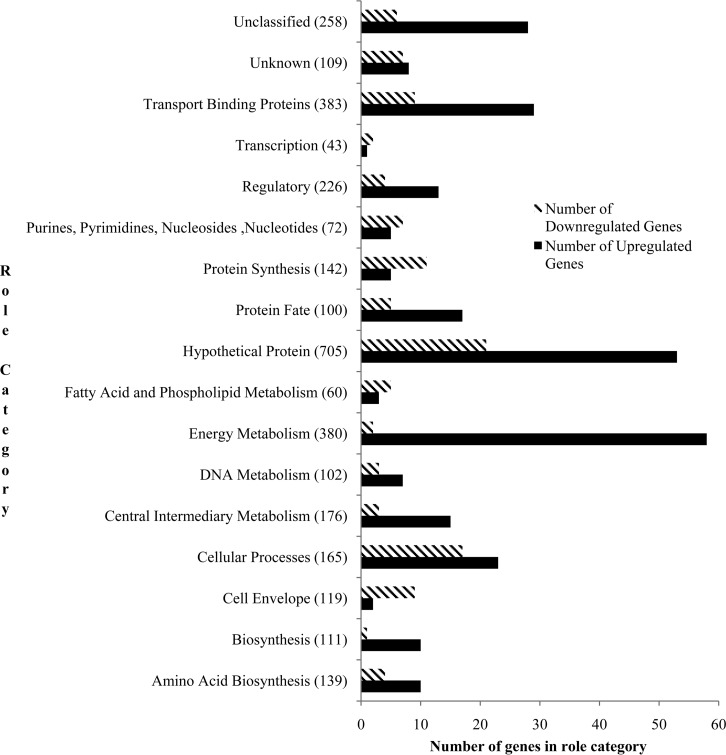
FIG 1.
Differentially expressed gene distribution among JCVI role categories. The JCVI role categories are listed on the y axis. The total number of genes in each role category is in parentheses. Black bars represent the numbers of genes upregulated following ClO2 exposure; hashed bars represent the numbers of genes downregulated following exposure to ClO2.

