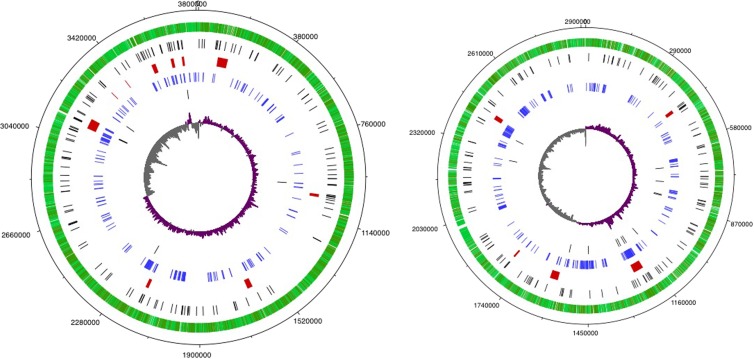
FIG 2.
Diagrams of the large and small B. thailandensis chromosomes. Base numbers are shown in the outermost ring. The next ring shows annotated genes in light and dark green for strand orientation. The ring of black hash marks indicates pseudogenes. The ring showing red bars illustrates genomic islands. QS-controlled genes are shown in blue in the next ring followed by pseudogenes in QS regulon (black). The innermost ring shows GC skew (positive values in purple and negative values in gray). The images were generated with DNAplotter (67).

