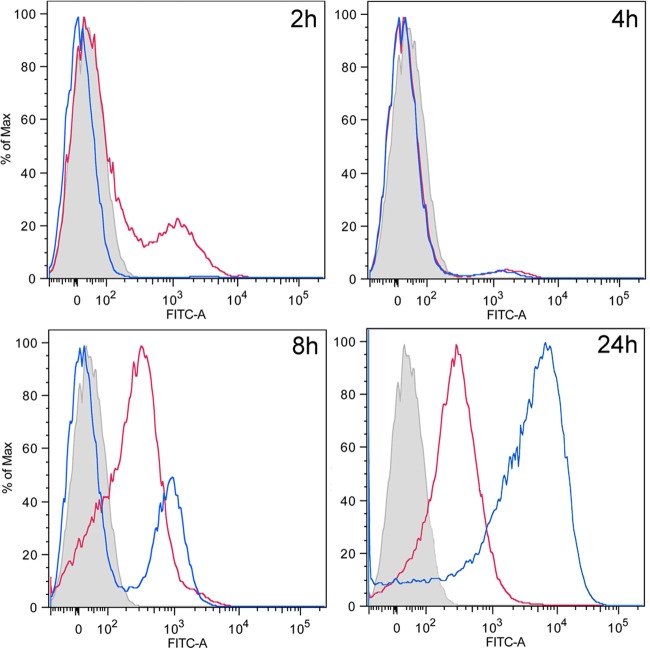
FIG 10.
Flow cytometry analysis of lapF::gfp expression in planktonic populations of KT2440 and the lapA mutant mus-42 grown in LB medium under static conditions. The y axis represents relative cell counts. The x axis shows arbitrary fluorescence units in a logarithmic scale. Blue and red lines correspond to planktonic wild-type and lapA mutant cells, respectively, recovered from the well. The gray peak corresponds to control cells with no gfp reporter and is shown as a nonfluorescent negative control. Shown are results from samples taken after 2, 4, 8, and 24 h.

