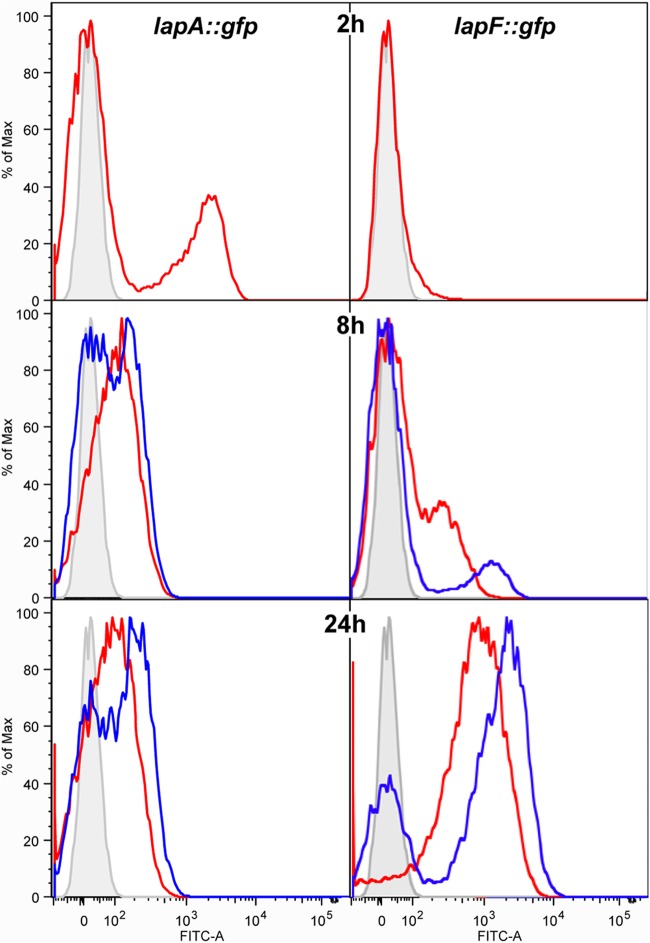
FIG 3.
Flow cytometry analysis of lapA::gfp and lapF::gfp expression in planktonic and biofilm populations. The y axis represents relative cell counts. The x axis shows arbitrary fluorescence units in a logarithmic scale. Red lines correspond to planktonic cells recovered from the well, and blue lines correspond to cells recovered from the surface of the coverslip. The gray peak corresponds to KT2440 cells with no gfp reporter and is shown as a nonfluorescent negative control to identify populations of gfp-harboring cells with no above-background fluorescence. Shown are results from samples taken after 2, 8, and 24 h. FITC, fluorescein isothiocyanate; Max, maximum.

