FIG 3.
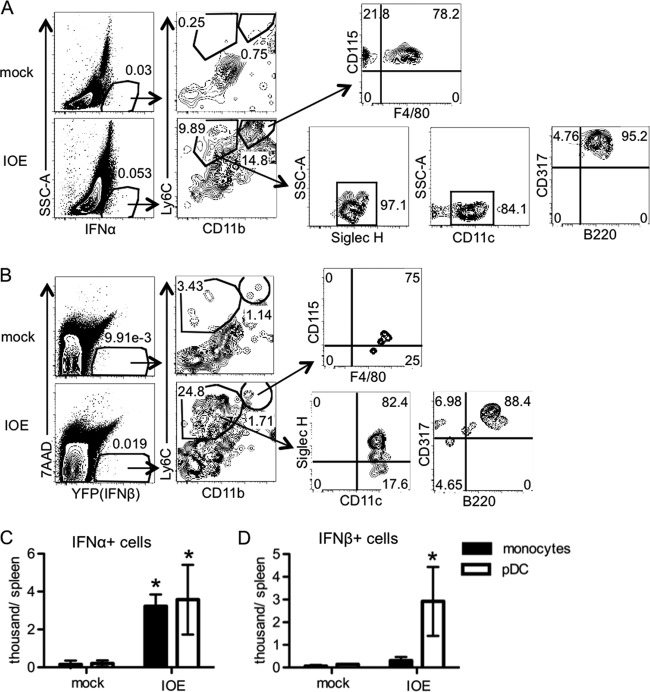
pDCs and monocytes produce type I IFNs during IOE infection. IOE-infected mice were analyzed for production of type I IFNs by intracellular staining for IFN-α and by using IFN-β–YFP reporter mice on day 7 postinfection. (A) Representative flow cytometric plots of intracellular staining for IFN-α+ cells are shown. Monocytes were characterized as Ly6C+ CD11b+ CD115+ F4/80+/− (top). pDCs were characterized as Ly6C+ CD11b− Siglec H+ CD11clo CD317+ B220lo (bottom). (B) Representative flow cytometric plots of the gating strategy to identify YFP+ cells (IFN-β+ cells) are shown. Monocytes were characterized as Ly6C+ CD11b+ CD115+ F4/80+/− (top). pDCs were characterized as Ly6C+ CD11b− Siglec H+ CD11clo CD317+ B220lo (bottom). The numbers shown in the plots indicate the frequency (%) of cells within the gated region. (C) Absolute numbers of IFN-α+ pDCs and monocytes are shown. (D) Absolute numbers of YFP (IFN-β)+ pDCs and monocytes are shown. Asterisks indicate a significant difference compared to the counterpart mock controls (P < 0.05). Data are from two separate experiments, and at least four animals were used for each group.

