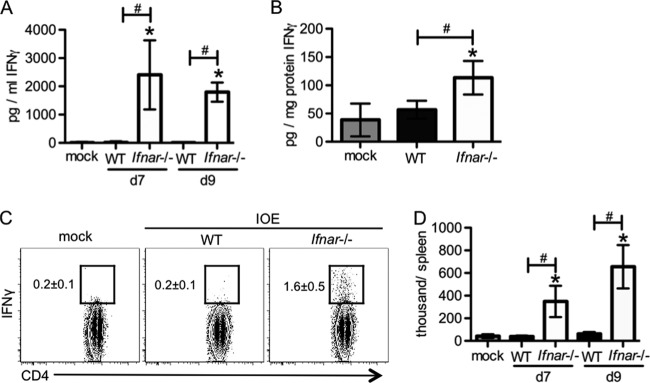
FIG 5.

Suppression of IFN-γ production by type I IFNs during IOE infection. WT mice and Ifnar−/− mice were infected with IOE. IFN-γ expression was measured by ELISA and intracellular staining. (A) Serum IFN-γ concentrations at days 7 and 9 postinfection are shown. (B) Spleen IFN-γ concentrations at day 9 postinfection are shown. (C) Representative flow cytometric plots of intracellular staining for IFN-γ by CD4 T cells (gated on CD3+ CD4+ cells) in the spleens at day 7 postinfection are shown. The numbers (means ± SD) next to the square gates represent the percentage of IFN-γ+ cells among all the CD4 T cells. (D) Absolute numbers of CD4+ IFN-γ+ T cells for each spleen are shown. Asterisks indicate a significant difference compared to mock controls (P < 0.05). Number symbols (#) indicate a significant difference between the groups as indicated (P < 0.05). Data are from two separate experiments, and at least four animals were used for each group.
