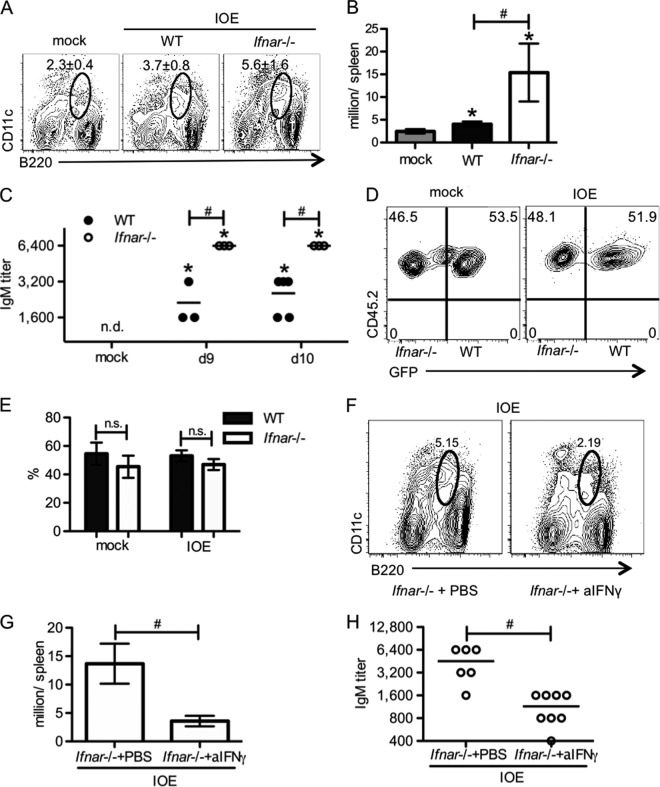
FIG 6.
IFN-γ induces pathogen-specific IgM production during IOE infection in the absence of Ifnar signaling. Plasmablasts (B220lo CD11clo) and serum Ehrlichia-specific IgM were measured at different time points post-IOE infection as indicated. (A) Representative flow cytometric plots of plasmablasts in the spleens of WT and Ifnar−/− mice at day 8 postinfection are shown. The numbers (means ± SD) above the circle gates represent the frequency of plasmablasts. (B) The absolute numbers of splenic plasmablasts are shown. (C) Titers of serum OMP-19-specific IgM in WT and Ifnar−/− mice at days 9 and 10 postinfection are shown. (D) Representative flow cytometric plots of WT (CD45.1− CD45.2+ GFP+) and Ifnar−/− (CD45.1− CD45.2+ GFP−) plasmablasts in spleens of mixed BM chimeric mice at day 7 postinfection are shown. The numbers in the quadrants represent the percentage of WT or Ifnar−/− cells among total splenic plasmablasts. (E) Quantification of percentage of WT and Ifnar−/− plasmablasts in panel D is shown. (F) Representative flow cytometric plots of splenic plasmablasts on day 8 postinfection in Ifnar−/− mice with or without anti-IFN-γ treatment are shown. The numbers above the gate represent the percentage of plasmablasts among all splenocytes. (G) Quantification of plasmablasts in panel F is shown. (H) Titers of serum OMP-19-specific IgM in Ifnar−/− mice with or without anti-IFN-γ treatment at day 8 postinfection are shown. Asterisks indicate a significant difference compared to uninfected controls (P < 0.05). Number symbols (#) indicate a significant difference between the groups as indicated (P < 0.05). “n.s.” indicates no significant difference (P > 0.05). “n.d.” indicates not detectable. At least four animals were used for each group.

