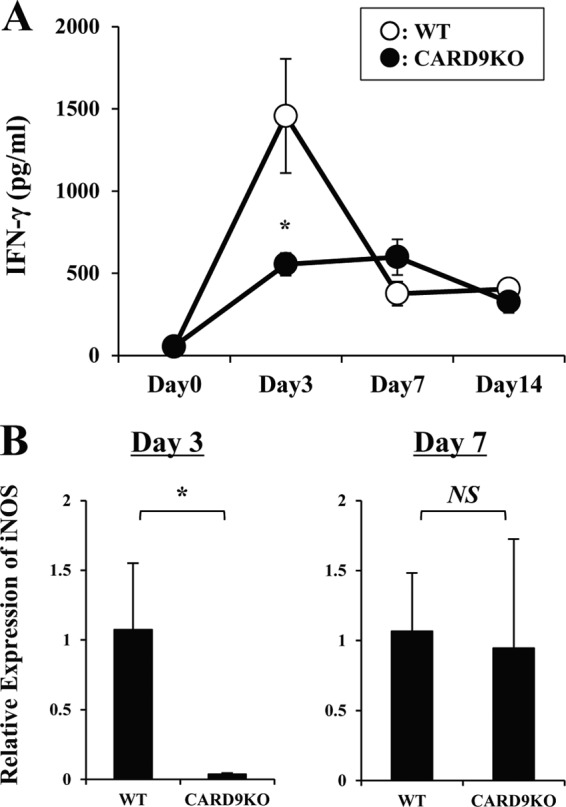
FIG 3.

Production of IFN-γ and iNOS after infection with C. neoformans. WT and CARD9 KO mice were infected intratracheally with C. neoformans. (A) IFN-γ production in lungs was measured at various time points. Data are means and SD for five or six mice. Experiments were repeated twice with similar results. *, P < 0.05. (B) Expression of iNOS mRNA in lungs was measured on days 3 and 7. Data are means and SD for five mice. Experiments were repeated twice with similar results. NS, not significant; *, P < 0.05.
