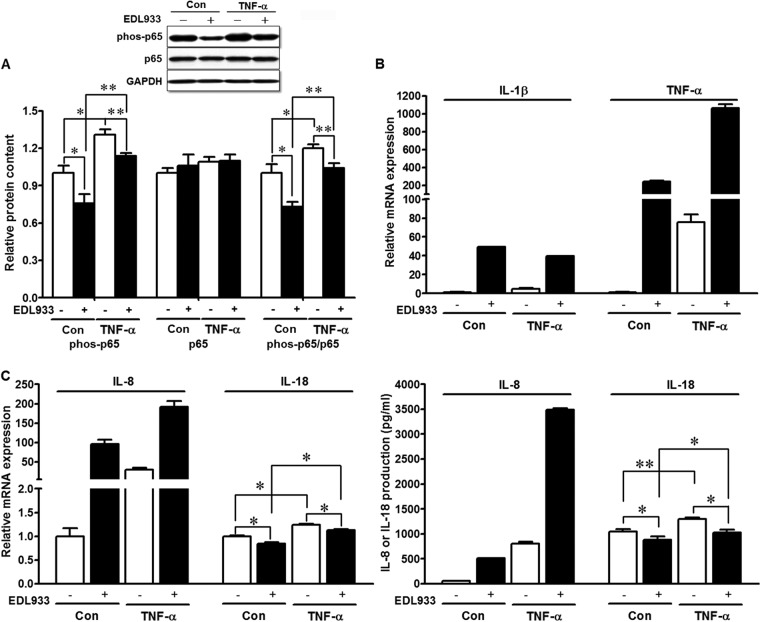
FIG 3.
Inflammatory responses in HT-29 cells untreated (Con) or treated with 10 ng/ml TNF-α for 12 h (TNF-α) and infected (+) or not (−) with E. coli O157:H7. (A) NF-κB p65 signaling analyzed by Western blotting. (Top) Representative bands. (Bottom) Statistical data. (B) IL-1β and TNF-α mRNA expression. (C) IL-8 and IL-18 mRNA expression and protein production. **, P < 0.01; *, P < 0.05. Shown are means and SEM; n = 4.

