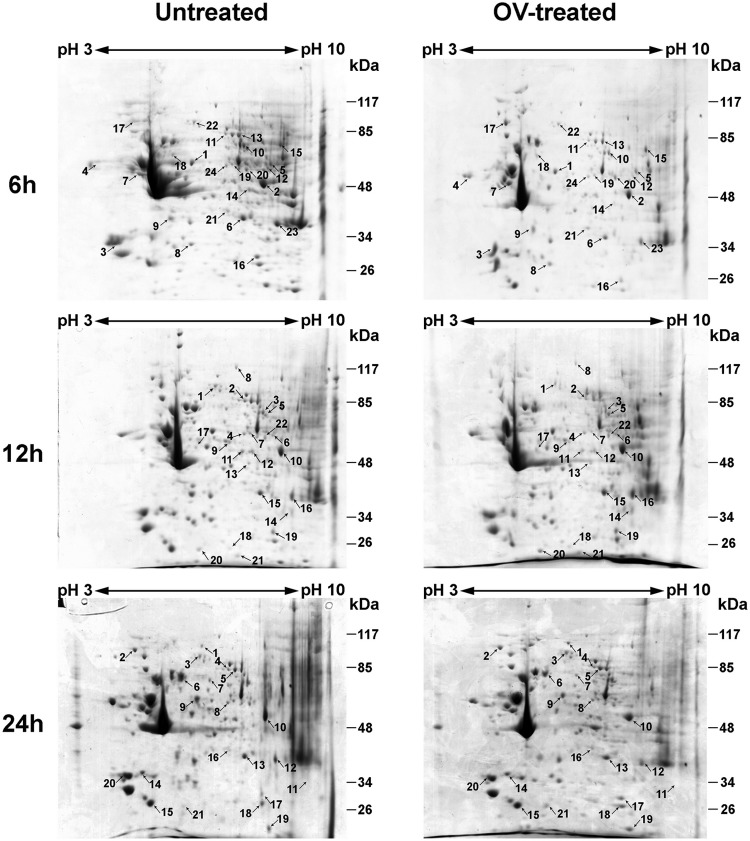
FIG 2.
2D electrophoresis of human PBMCs treated with O. viverrini (OV) for 6, 12, and 24 h and untreated PBMCs. IEF was performed with total protein extracted from PBMCs in the pH range from 3 to 10 (nonlinear), separated on 12% polyacrylamide gels, and stained with Coomassie brilliant blue R-250. Spots showing differential expression and the corresponding proteins were identified using LC-MS/MS and database searching. The spot numbers on the gels correspond to the numbers in Table 1.

