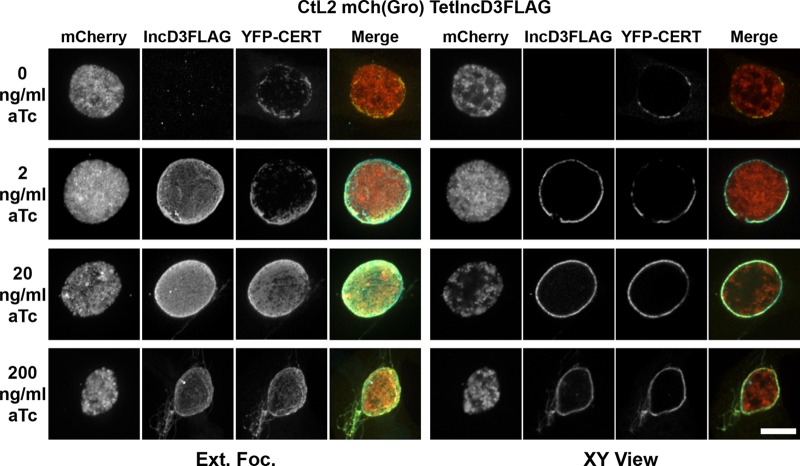
FIG 5.
IncD-3×FLAG expression leads to massive recruitment of CERT to the inclusion membrane. Confocal fluorescence micrographs show inclusions of the CtL2 mCh(Gro) TetIncD3F strain (mCherry; red) in HeLa cells expressing YFP-CERT (YFP-CERT; yellow). At 1 h postinfection, the infected cells were incubated in the absence (0 ng/ml aTc) or presence (2, 20, or 200 ng/ml aTc) of the indicated aTc concentration. The infected cells were fixed at 23 h post-aTc induction, coimmunostained using anti-FLAG (IncD3FLAG; blue), and imaged using a confocal microscope. The same imaging settings were used for all conditions, and the images were not manipulated after acquisition, so the intensities of the signals on the micrographs truly reflect the expression levels of the IncD-3×FLAG construct. The left and right groups of panels correspond to an extended-focus view combining all the confocal planes spanning an entire inclusion (Ext.Foc.) and a single plane crossing the middle of the inclusion (XY View), respectively. Merged images are shown in the right column for each group. Bar, 10 μm.

