
FIG 4.
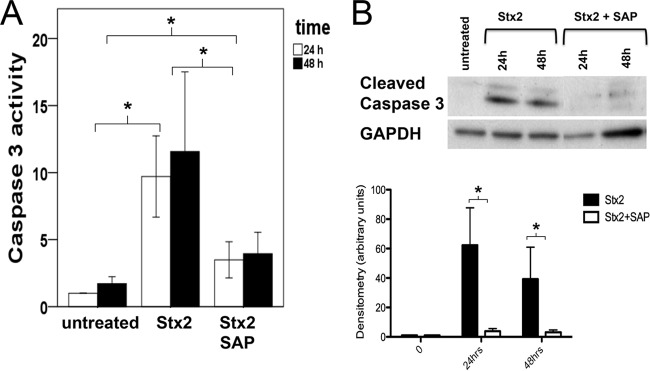
Caspase 3 activity and cleaved caspase 3. (A) Caspase 3 activity (in AU) after Stx2 incubation (1.5 ng/ml) for 24 or 48 h compared to untreated cells and after coincubation with SAP (3 mg/liter) as evaluated by ELISA. For statistical analysis, the values at 24 and 48 h were compared. (B) Amounts of cleaved caspase 3 after Stx2 incubation with or without addition of SAP after 24 and 48 h. Below is shown loading control with GAPDH. *, P < 0.05. Means and standard errors of the means of four independent experiments, performed in duplicate, are shown.