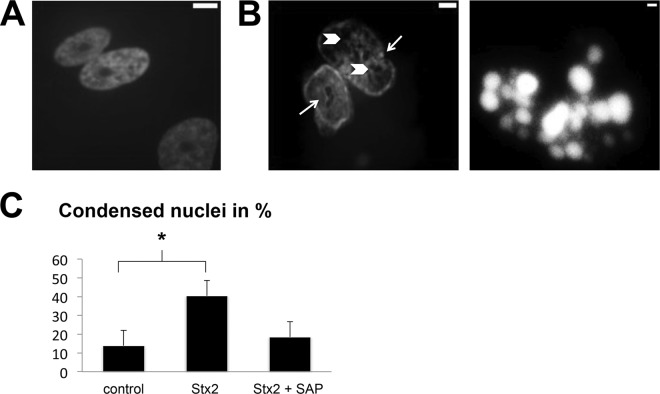
FIG 5.
Apoptosis, measured via the amount of condensed or apoptotic nuclei after Stx2 incubation. (A) Untreated control. (B) Nuclei of podocytes after treatment with 1.5 ng/ml Stx2. (Left) Typical enclosures/cysts (arrowheads) and indentations (arrows). (Right) An apoptotic body. (C) Content of condensed nuclei after Stx2 treatment compared to control or coincubation of Stx2 and SAP (3 mg/liter). *, P < 0.05. Means and standard deviations of three independent experiments are shown.

