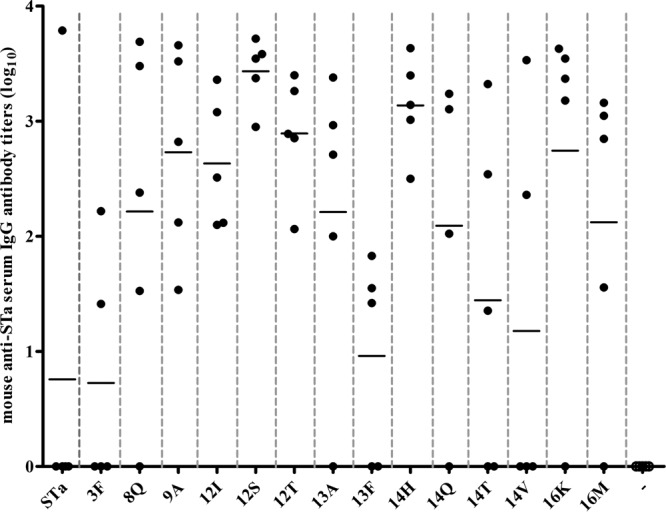
FIG 2.

Mouse serum anti-STa IgG antibody titers. Anti-STa IgG antibodies in serum samples of the immunization and control groups (five mice per group) were titrated in ELISA using STa-ovalbumin conjugates (10 ng per well of Costar plates; coating agent) and HRP-conjugated goat anti-mouse IgG (1:3,000; the secondary antibodies). The anti-STa antibody titer was calculated from the highest dilution of a serum sample that produced an ELISA OD of >0.3 (above the background). Each dot represented a mouse IgG titer, and the bar indicated the mean titer of the group. Mouse group labels (on the x axis) indicated the immunization groups (immunized with each different fusion antigen) and the control group (−). The mean antibody titer (mean ± the standard deviation) and P value (compared to titers of mice in the group immunized with fusion 3×STa-dmLT) were calculated for the groups immunized with different fusions—STa, 3×STa-dmLT (0.76 ± 1.69); 3F, 3×STaS3F-dmLT (0.73 ± 1.03, P = 0.97); 8Q, 3×STaE8Q-dmLT (2.22 ± 1.52, P = 0.19); 9A, 3×STaL9A-dmLT (2.73 ± 0.91, P = 0.051); 12I, 3×STaN12I-dmLT (2.63 ± 0.57, P = 0.047); 12S, 3×STaN12S-dmLT (3.43 ± 0.29, P = 0.008); 12T, 3×STaN12T-dmLT (2.89 ± 0.52, P = 0.027); 13A, 3×STaP13A-dmLT (2.21 ± 1.46, P = 0.17); 13F, 3×STaP13F-dmLT (0.96 ± 0.89, P = 0.82); 14H, 3×STaA14H-dmLT (3.14 ± 0.43, P = 0.016); 14Q, 3×STaA14Q-dmLT (2.1 ± 1.46, P = 0.26); 14T, 3×STaA14T-dmLT (1.44 ± 1.49, P = 0.52); 14V, 3×STaA14V-dmLT (1.18 ± 1.67, P = 0.70); 16K, 3×STaT16K-dmLT (2.74 ± 1.54, P = 0.089); 16M, 3×STaT16M-dmLT (2.12 ± 1.35, P = 0.35)—and for the control group (0 ± 0, P = 0.37).
