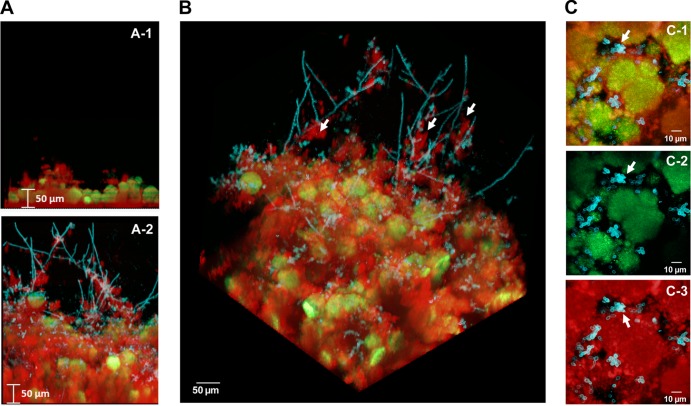
FIG 1.
Three-dimensional architecture of the cospecies biofilm. Representative images of single-species and cospecies biofilms grown for 42 h are shown. Bacterial microcolonies expressing GFP appear green, while fungal cells labeled with ConA-tetramethylrhodamine appear blue. EPS labeled with Alexa Fluor 647-dextran appear red. (A) Orthogonal views of the biofilms, illustrating the overall differences in the accumulation of biofilms between cospecies and S. mutans single-species biofilms. (B) Three-dimensional rendering of the cospecies biofilm, illustrating the complexity of its architecture. Bacterial microcolonies and yeast forms of C. albicans are enmeshed and surrounded by an EPS-rich matrix, while hyphae (indicated by white arrows) extend from the biofilm into the fluid phase and are coated with EPS. (C) Projection images of the first 20 μm (from the surface of attachment) of a cospecies biofilm, illustrating the spatial relationship between C. albicans, S. mutans, and EPS. (C-1) Merged image of all three components; (C-2) merged image of C. albicans and S. mutans; (C-3) C. albicans and EPS. The arrows indicate that there is little to no direct association between S. mutans and C. albicans (C-1 and C-2). In contrast, it is readily apparent that the fungal cells are associated with EPS (C-3), which then contacts the microcolonies (C-1).

