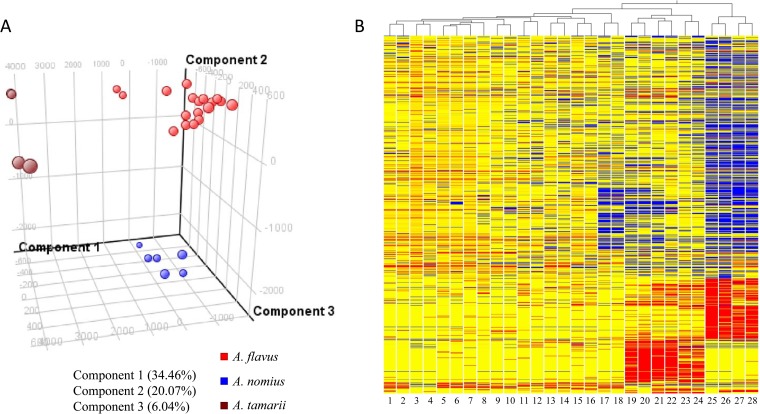
FIG 3.
(A) Principal component analysis and (B) hierarchical clustering dendrogram of metabolic fingerprints of the 11 clinical isolates reported as A. flavus and three reference strains. Molecular features (1,016) defined by retention time and mass pair were included. The 3D PCA score plot for component PC1 versus component PC2 versus component PC3 is presented. The percentages of variance in the data set reflected by the first three PCs for each sample are shown. Hierarchical clustering of different fungal isolates is represented by a heat map and a dendrogram. Clustering was performed using Euclidean distance and average linkage. Blue and red indicate negative and positive log ratios, respectively. Two biological replicates were performed for each sample. Lanes 1 and 2, PW2952; lanes 3 and 4, PW2956; lanes 5 and 6, PW2957; lanes 7 and 8, PW2960; lanes 9 and 10, PW2962; lanes 11 and 12, ATCC 204304; lanes 13 and 14, PW2953; lanes 15 and 16, PW2954; lanes 17 and 18, PW2961; lanes 19 and 20, CBS260.88T; lanes 21 and 22, PW2955; lanes 23 and 24, PW2959; lanes 25 and 26, CBS104.13T; lanes 27 and 28, PW2958.

