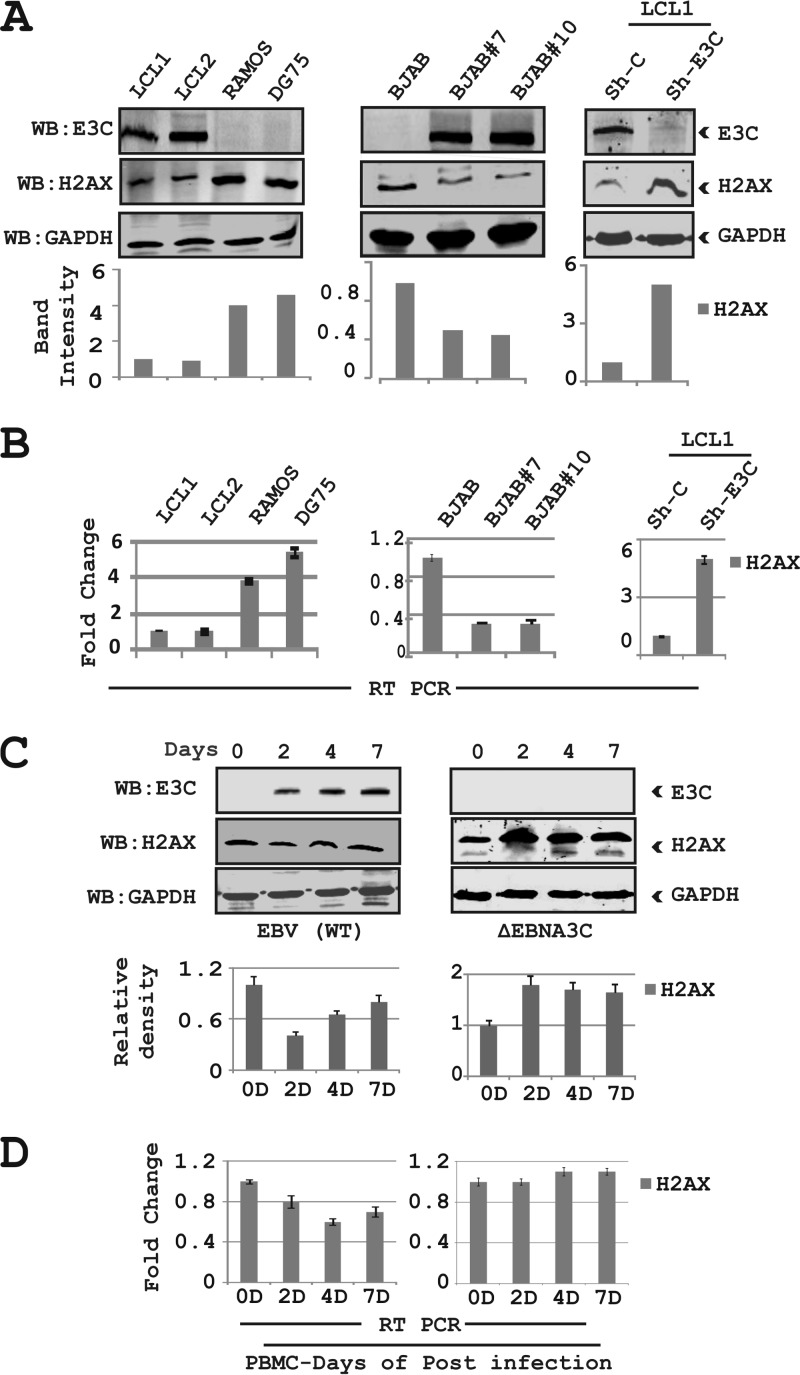
FIG 1.
EBNA3C downregulates total H2AX levels in B cells. (A, left) Endogenous expression of H2AX in EBV-positive cell lines (LCL1 and LCL2) and EBV-negative Burkitt's lymphoma cell lines (Ramos and DG75) was analyzed at the protein level. (Middle) Endogenous expression of H2AX in BJAB (EBV-negative) BJAB#7, and BJAB#10 (EBNA3C stably expressing) cells was analyzed by WB. (Right) LCL1 cells stably transduced for sh-control and sh-EBNA3C were harvested to determine the protein expression levels of H2AX. The relative density of H2AX was analyzed by normalization with GAPDH. (B) All groups of cells were extracted by using TRIzol reagent, and the RNA concentration was estimated by using a Nanodrop instrument (Eppendorf Inc., Hamburg, Germany). Transcript levels for the H2AX gene are represented by fold changes, and the experiments were performed in triplicates. (Left) Results of LCL1 and LCL2 compared to Ramos and DG75 cells. (Middle and right) Results of BJAB cells compared to BJAB#7 and BJAB#10 cells (middle) and LCL1 stably knocked down for EBNA3C and the control vector (right). (C and D) PBMCs were infected with wild-type (WT) EBV and ΔEBNA3C virus for up to 7 days. Cells were harvested, and expression of H2AX was monitored in a time-dependent manner for protein and transcript levels by performing WB analysis and real-time PCR. All panels show representative data of repeated experiments.

