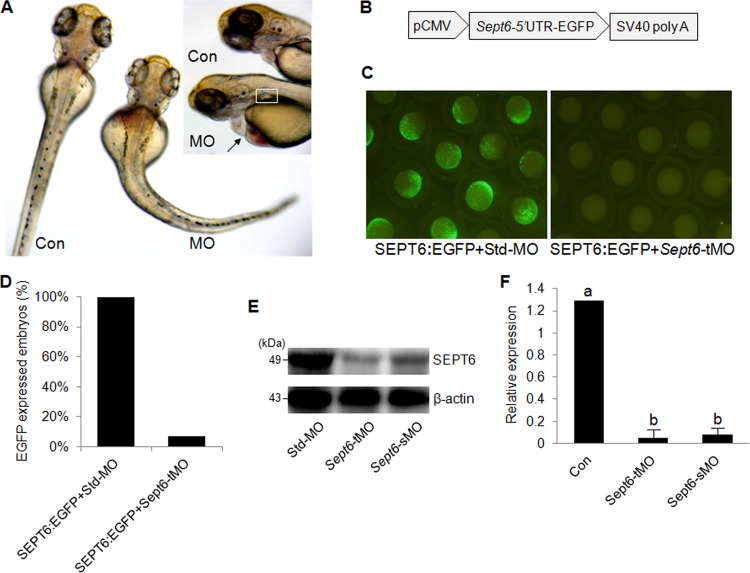
FIG 3.
Global defects caused by sept6 knockdown and specificity tests for MOs. (A) Representative images of control embryos (Con) and morphant (MO) embryos. Arrow, heart pericardium; square, pronephric cyst. The enlarged images of the brain area are shown in the inset. (B) Diagram of the construct containing the sept6 5′-UTR fused with EGFP and a simian virus 40 poly(A) tail, which is driven by the CMV promoter. (C) Representative images of embryos coinjected with the plasmid and sept6-tMO or std-MO. (D) Quantification of EGFP-expressing embryos from panel C. (E) Protein levels of SEPT6 in the control embryos, tMO morphants, and sMO morphants at 24 hpf. (F) Quantification of relative expression levels of SEPT6 from the Western blot shown in panel E. The expression levels of SEPT6 were normalized against β-actin. The letters a and b represent statistically significant differences (P < 0.001, calculated by using Student's t test).

