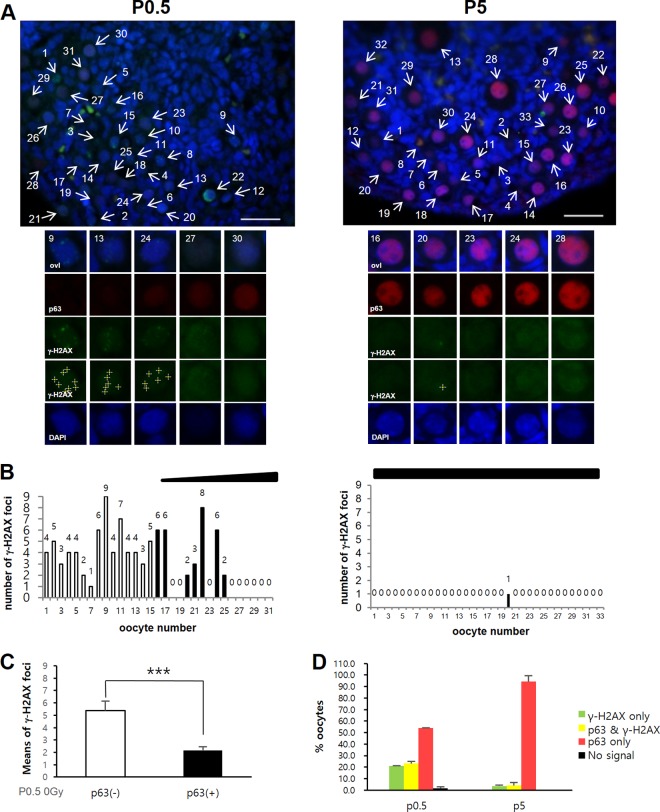
FIG 1.
A significant fraction of newborn oocytes initiate TAp63α expression before completing meiotic DNA DSB repair. (A) Representative sections of nonirradiated P0.5 or P5 ovary sections stained for p63 (red), γ-H2AX (green), or DAPI (blue). Images of P0.5 and P5 ovaries were captured using the same camera exposure times. Representative oocytes from the upper panels are enlarged in the lower panels, numbered, and arranged according to TAp63a expression level. Crosses denote γ-H2AX foci counted using ImageJ. See also Fig. S1 in the supplemental material. Scale bars, 50 μm. (B) The numbers of γ-H2AX foci (displayed above the bars) in each oocyte arrayed in panel A and in Fig. S1 in the supplemental material are plotted and displayed. The gradient slope above the plot indicates the relative level of TAp63α expression along the array. Unfilled bars denote numbers of γ-H2AX foci in oocytes lacking in TAp63α expression. Filled bars (or the absence of a bar) denote the numbers of γ-H2AX foci in oocytes with detectable TAp63α expression. (C) Mean numbers of γ-H2AX foci in P0.5 oocytes lacking TAp63α expression [p63(−)] or having TAp63α expression [p63(+)]. n = 4 mice; error bars indicate the standard errors of the mean (SEM). ***, P ≤ 0.02 (Mann-Whitney test). (D) Percent oocytes in P0.5 or P5 ovaries with only γ-H2AX foci, both TAp63α expression and γ-H2AX foci, or only TAp63α expression. Oocytes lacking both signals were nominal. Averages of 141 oocytes (P0.5, 2 mice) or 199 oocytes (P5, 2 mice) were tested; error bars indicate the SEM.

