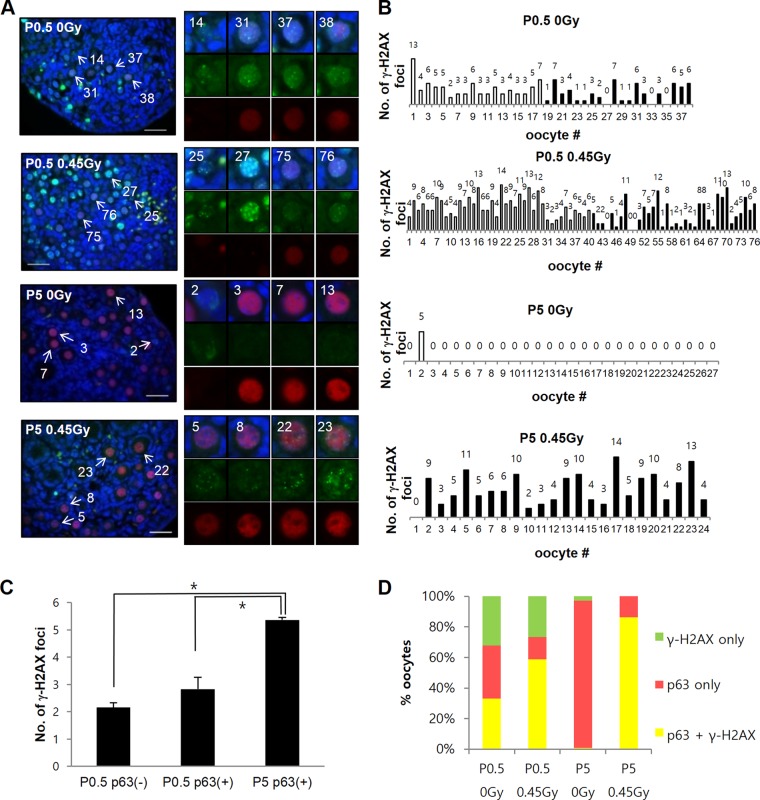
FIG 5.
Newborn P0.5 oocytes induce weak γ-H2AX focus formation compared to P5 oocytes after IR treatment. (A) Representative immunofluorescence sections of P0.5 or P5 ovaries either not irradiated or irradiated with 0.45 Gy of IR and stained for p63 (red), γ-H2AX PAb (green), and DAPI (blue) 2 h after IR treatment. The oocytes are numbered according to the level of TAp63α expression, as described in Fig. 1. The indicated oocytes are magnified on the right. Bars, 50 μm. (B) Plot showing the number of γ-H2AX foci in oocytes of ovary sections shown at left arrayed from low to high TAp63α expression, as described in Fig. 1. (C) The average numbers of γ-H2AX foci increased in P0.5 oocytes lacking TAp63α expression [P0.5 p63(−)] or containing TAp63α expression [P0.5 p63(+)] or P5 oocytes, which all contain TAp63α expression [P5 p63(+)] 2 h after 0.45-Gy IR treatment. n = 2 mice for each P0.5 and P5 condition; error bars indicate the SEM. *, P < 0.05 (Kruskal-Wallis test). The numbers of oocytes were as follows: P0.5, 0 Gy, 133; P0.5, 0.45 Gy, 192; P5, 0 Gy, 50; and P5, 0.45 Gy, 44. (D) Percent oocytes in nonirradiated or irradiated P0.5 versus P5 ovaries analyzed in panel C containing γ-H2AX only (green fraction), TAp63α only (red fraction), or both γ-H2AX and TAp63α (yellow fraction).

