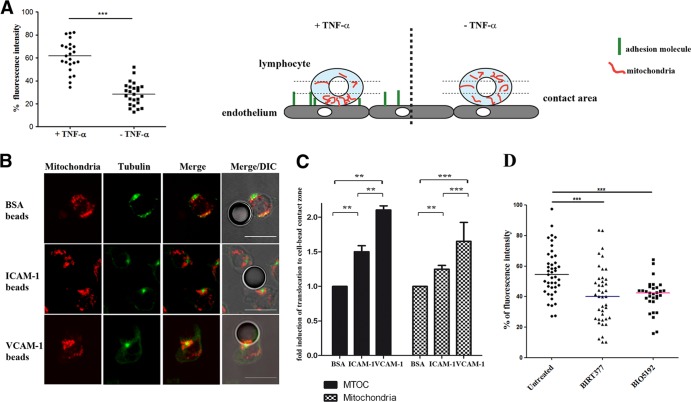
FIG 2.
Mitochondrial redistribution depends on integrin engagement. (A) Quantification of mitochondrial redistribution in lymphoblasts adhered to resting or activated HUVEC monolayers. Mitochondrial redistribution is calculated as the percentage of mitochondrial fluorescence intensity (maximal Z-stack projections of Mitotracker Orange staining) located in the contact area with endothelial cells (defined as the third of the cell close to the HUVEC monolayer; see scheme). Data are shown as a scatter plot; horizontal lines depict medians of 23 and 25 unpolarized cells adhered, respectively, on either TNF-α-activated or nonactivated HUVEC. Three independent experiments were performed (***, P < 0.001). The scheme illustrates the method used to quantify mitochondrial redistribution. (B) Representative images of conjugates formed between CH7C17 cells and latex beads coated with BSA, ICAM-1, or VCAM-1, stained for α-tubulin (green) and mitochondria (red). DIC, differential interference contrast. Scale bars, 10 μm. (C) Fold inductions, in comparison to a BSA negative control, of MTOC and mitochondrial relocalization toward the coated beads. A minimum of 30 (BSA), 95 (VCAM-1), or 140 (ICAM-1) cells were analyzed for each experiment. (D) Quantification of mitochondrial redistribution in lymphoblasts untreated (n = 43) and pretreated (15 min at 37°C) with BIRT377 (n = 41) or BIO5192 (n = 31) to block LFA-1 or VLA-4 integrins and incubated with activated TNF-α-activated HUVEC for 20 min. Data are shown as a scatter plot; horizontal lines depict medians from two independent experiments of nonpolarized cells adhered to activated HUVEC (***, P < 0.001; **, P < 0.01 [by one-way ANOVA]).

