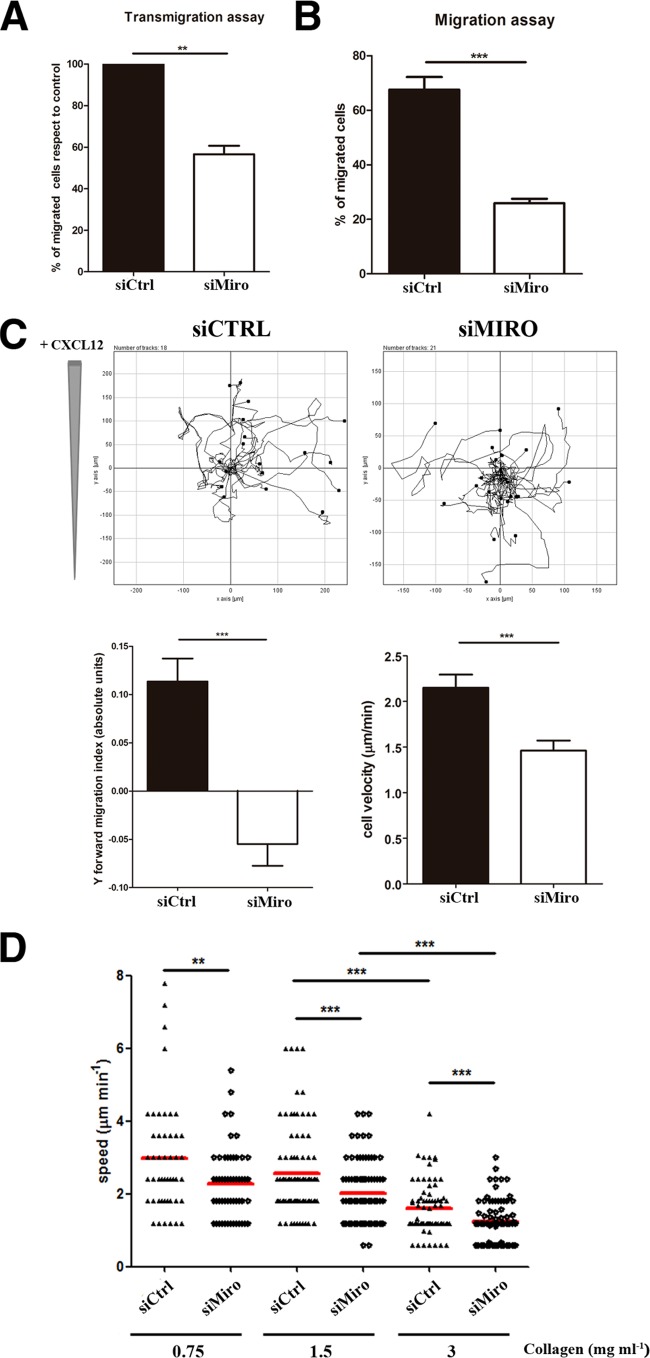
FIG 4.
Miro-1 controls lymphocyte migration and chemotaxis. (A) Quantification of the transmigration of control and Miro-1-silenced CEM T cells across Transwell filters (5-μm pore size) coated with a TNF-α-activated HUVEC monolayer (see Materials and Methods). Data are expressed as a percentage with respect to transmigrated control cells. (B) Migration of control and Miro-1-silenced CEM T cells across uncoated Transwell filters. Migration is calculated as a percentage of input cells. Data in panels A and B are means ± SEM for two independent experiments run by duplicate (***, P < 0.001; **, P < 0.01). (C) Cell trajectory plots of control and Miro-1-silenced cells migrating toward CXCL12 in a collagen matrix (1.6 mg ml−1). The upper panels show results from a representative experiment out of three. The lower panels show quantification of movement toward the chemokine (Y forward migration index) and cell speed (μm min−1) of 98 control and 102 Miro-1-silenced cells from three independent experiments (mean ± SEM; ***, P < 0.001). (D) Velocities of single migrating control and Miro-1-silenced CEM cells (dots) in collagen gels with various densities. Data are shown as a scatter plot; horizontal lines depict means from three independent experiments (***, P < 0.001; **, P < 0. 01).

