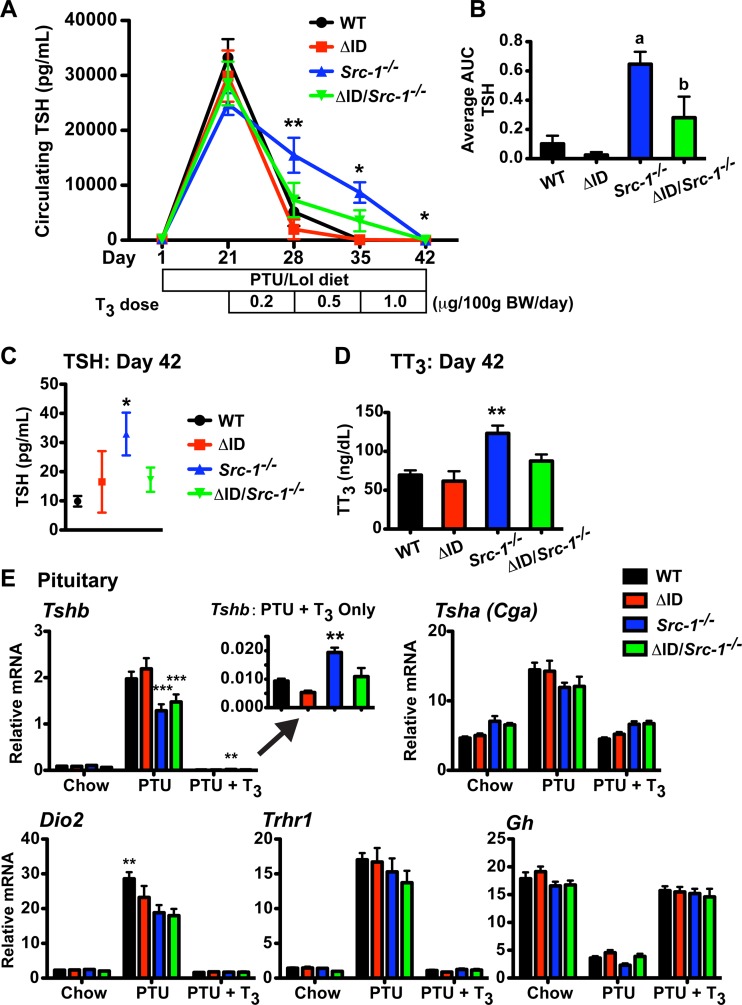
FIG 3.
NCoRΔID/ΔID Src-1−/− mice suppress plasma TSH similarly to WT mice in response to T3. (A) The plasma TSH concentration was repeatedly measured in WT, NCoRΔID/ΔID (ΔID), Src-1−/−, and NCoRΔID/ΔID Src-1−/− (ΔID/Src-1−/−) male mice after 21 days of a LoI/PTU diet and consecutive 7-day treatments with increasing concentrations of T3 (0.2, 0.5, and 1.0 μg/100 g BW/day; n = 7 or 8). The data are presented as means ± SEM and were analyzed by repeated-measures 2-way ANOVA with the Bonferroni post hoc test. *, P < 0.05 for Src-1−/− versus all; **, P < 0.01 for Src-1−/− versus all. (B) AUC of each mouse averaged by genotype (n = 7 or 8). The data are presented as means and SEM and were analyzed by 1-way ANOVA with Tukey's multiple-comparison post hoc test. a, P < 0.01 for Src-1−/− versus WT and ΔID; b, P < 0.05 for Src-1−/− versus ΔID/Src-1−/−. (C and D) Circulating TSH levels and TT3 levels at day 42 following 7 days of treatment with the largest dose of T3. (C) n = 7 or 8. The data are presented as means ± SEM and were analyzed by repeated-measures 2-way ANOVA with a Bonferroni post hoc test. *, P < 0.05 for Src-1−/− versus all. (D) n = 7 or 8. The data are presented as means and SEM and were analyzed by 1-way ANOVA with Tukey's multiple-comparison post hoc test. **, P < 0.01 for Src-1−/− versus all. (E) Analysis of mRNA expression of TH-responsive targets in the pituitary by qPCR in the indicated groups. Expression of Tshb, Tsha, Dio2, Trhr1, and Gh was normalized to 18S rRNA (n = 7 to 12). The inset highlights Tshb mRNA expression at day 42 following 7 days of treatment with the largest dose of T3. The data are presented as means and SEM and were analyzed by 2-way ANOVA with a Bonferroni post hoc test. **, P < 0.01 versus all; ***, P < 0.001 versus WT and ΔID.

