FIG 6.
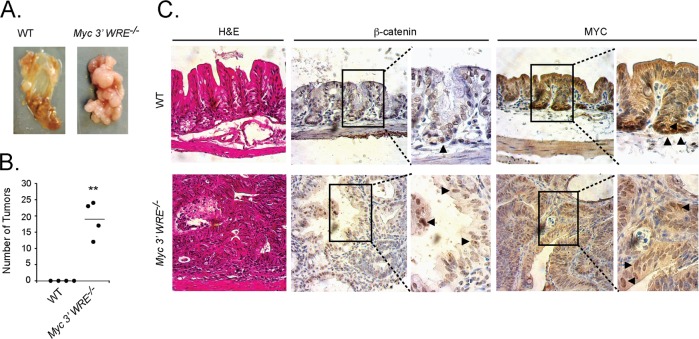
Myc 3′ WRE−/− mice subjected to the AOM/DSS carcinogenesis protocol develop numerous tumors in the cecum. (A) Representative images of ceca isolated from WT and Myc 3′ WRE−/− mice following AOM and DSS treatment. (B) Quantification of cecal tumors in mice with the indicated genotypes (n = 4 mice examined per group). Errors are standard errors of the means (**, P < 0.01). (C) Hematoxylin and eosin (H&E)-stained sections and immunohistochemical analysis of β-catenin- and MYC-expressing cells in the ceca of mice with the indicated genotypes. The arrowheads in the enlarged panels identify a subset of positive cells. Shown are representative images from 4 mice examined per genotype.

