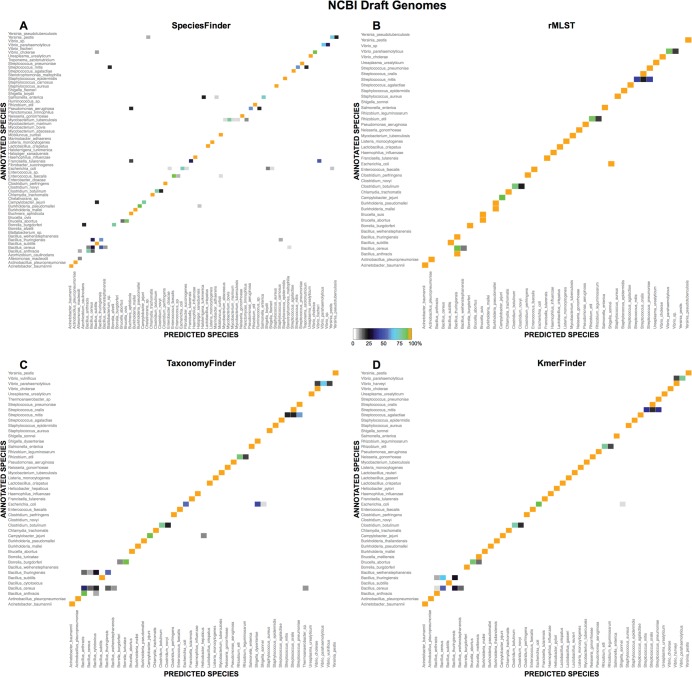
FIG 3.
Predictions for the most common species of the NCBIdrafts set. For each method, indicated at the top of each panel, the results for a given species are only shown if the method made a prediction for five or more isolates annotated as this species (e.g., if there are five isolates annotated as species A in the data set, but the method was not able to make a prediction for one of the isolates, the species is not shown) or if two or more isolates are predicted as this species (e.g., if there are no isolates annotated as species B in the data set but two isolates annotated as species C are predicted to be species B, then species B is shown).

