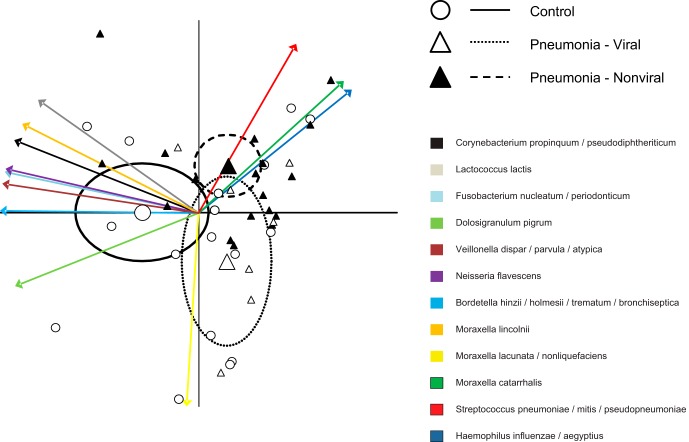
FIG 2.
Multivariate analysis including 12 most common OTUs. PCA-biplot representation of microbiota of control children and children with bacterial (nonviral) and viral pneumonia. Arrows represent projections of the taxa that are responsible for the differences between groups. Large points represent the group means, and ellipses represent 95% confidence limits.

