
FIG 4.
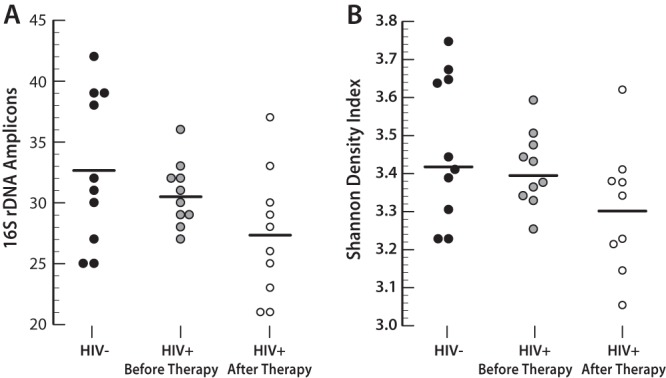
Microbial diversity analysis of salivary microbial flora. Profiles were determined through denaturing gradient gel electrophoresis (DGGE) for subjects who were HIV positive or HIV negative (horizontal lines indicate mean values). (A) Forty-two distinct amplicon fragments (bands) were detected from all DGGE profiles. Compared with the HIV-negative group, fewer bands were found in the HIV-positive group before therapy and the HIV-positive group after therapy (P = 0.05, Mann-Whitney U test). (B) The differences between groups were confirmed by Shannon diversity index values, which showed that HAART significantly decreased the overall microbial diversity (P = 0.025, Mann-Whitney U test).