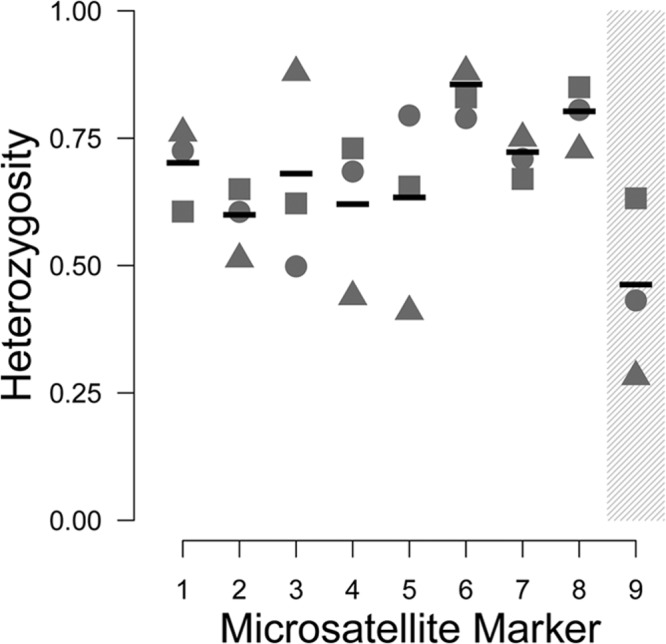
FIG 1.

Per-population diversity index for each microsatellite studied. Nine microsatellites were typed in multiple samples from Uganda (triangles), San Francisco (circles), and Spain (squares), and heterozygosity (He) values were calculated for each population. Mean He values are indicated by horizontal bars. A higher He value indicates that a marker is more variable and thus more informative for population and transmission studies. Marker MS9 (shaded) was determined to be in linkage disequilibrium with the dhps locus.
