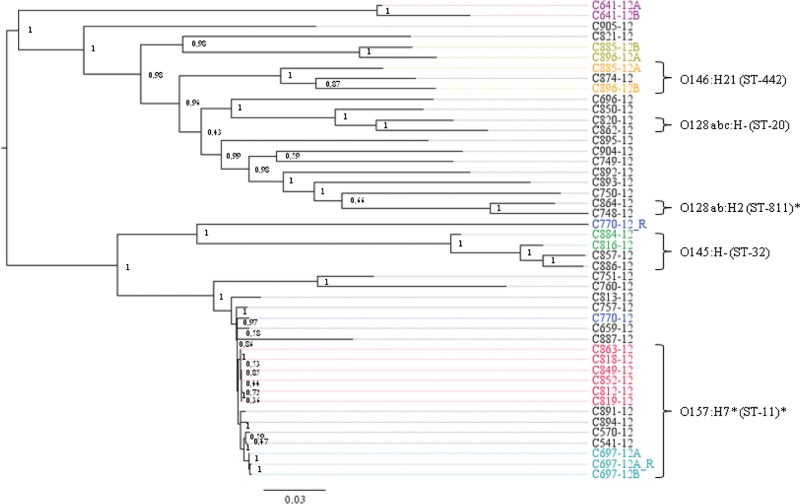
FIG 2.
Phylogeny of the isolates by the SNPtree method. Isolates known to be epidemiologically related are shown in the same color, with the red group constituting the outbreak isolates. Serotypes and MLST types are shown for the main clusters. An asterisk indicates types with slight variations within the cluster. Bootstrap values are assigned to each node.

