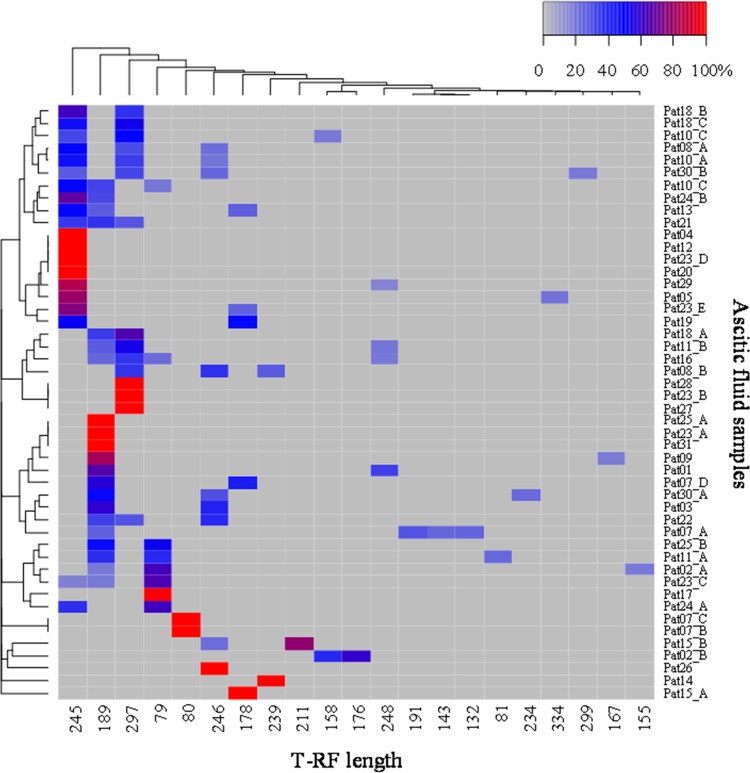
FIG 3.
Two-way clustering of T-RFLP profiles of bacterial DNA from ascitic fluid samples generated by restriction digest using the restriction endonuclease MspI (deviation = 2) displayed as a heat map. Ascitic fluid samples (n = 48) from 29 patients are represented by rows, whereas T-RF are represented by columns. Each square in the heat map represents the relative abundance of a single T-RF per sample measured by fluorescence intensity and indicated by color. Rows are clustered according to the similarity of the T-RFLP profile from each sample, and columns are clustered by cooccurring T-RF within the sample based on the Bray-Curtis index. The color key for the relative abundance of T-RF is shown in the upper right corner. T-RF length is in base pairs.

