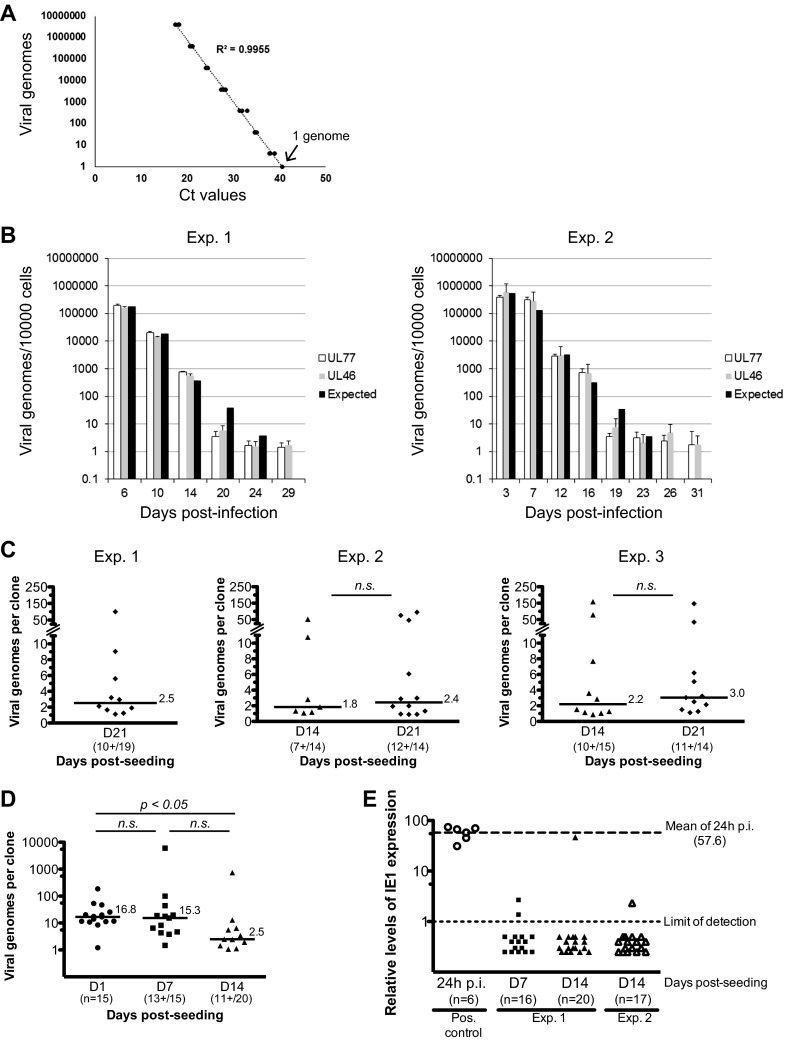
FIG 11.
Viral genome persistence in pNSCs. (A) A viral genome standard curve was generated by serial dilution of a highly purified HB5 BAC preparation, diluted in 500 ng of native pNSC genomic DNA. The TaqMan quantitative PCR assay was optimized such that one copy of the viral genome could be detected. Two amplification reactions of sequences in the UL77 and UL46 genes were developed. A representative example of the standard curve using the UL77 amplicon is shown. (B) Hues9 pNSCs were infected with TB40E at an MOI of 5. At various time points after infection (as indicated), cells were harvested, DNA was extracted, and quantitative real-time PCR was performed to determine the number of viral genomes per 10,000 cells. PCR assays were performed in triplicate, and the average of these is represented on the graph. The results of two independent experiments are shown. Two separate amplicons in the highly conserved coding region of the UL77 and UL46 genes were used for quantification of viral genomes. Based on the averaged viral genome copy numbers obtained at day 6 p.i. (left panel) or at day 3 p.i. (right panel), the expected theoretical number of genomes for each subsequent time point was calculated assuming a neutral selection model. (C) Hues9 pNSCs were infected with TB40E at an MOI of 5. At 24 h p.i., cells were harvested and reseeded at low density (0.5 cell/well) in 96-well plates for clonogenic expansion. At the indicated time points postexpansion, DNA was extracted from pNSC clones, and quantitative real-time PCR was performed as described above. PCR assays were performed in triplicate (95% of the DNA sample was analyzed) and the sum of these is represented on the graph. Three independent experiments were performed. The total numbers of clones analyzed and number of clones positive for viral DNA are shown for each time point. The number of viral genomes from individual clones is presented in dot plots. Only clones positive for viral DNA are depicted. The median number of viral genomes in positive clones is shown as a line for each time points. Differences were not statistically significant according to a Mann-Whitney test. (D) Hues9 pNSCs were infected and clonally expanded as described for panel C. At the indicated time points postexpansion, DNA was extracted from pNSC clones, and quantitative real-time PCR was performed as described above. For the day 1 (D1) time point, DNA was extracted from random wells, whereas for the other time points, DNA was extracted from wells with visible colonies. The results are depicted in dot plots as described for panel C. Statistical significance was determined by a Kruskal-Wallis test combined with Dunn's multiple comparison test. (E) Hues9 pNSCs were infected and clonally expanded as described for panel C. At the indicated time points postexpansion, RNA was extracted from pNSC clones, reverse transcribed using an IE1-specific primer and quantitative real-time PCR was performed to monitor IE1 expression as described in Materials and Methods. PCR assays were performed in quadruplicate (45% of the RNA sample was used), and the averages of these are represented in the graph. Two independent experiments were performed. The number of clones analyzed for each experiment is shown. Positive controls were generated using RNA extracted from 1 IE+ pNSCs (24 h p.i.) diluted in 25,000 native pNSCs. The relative levels of expression for each clone (shown as individual dots) and limits of detection (light dashed line, set at 1) were calculated using a standard curve constructed from a dilution series of infected pNSC cDNA. Mean levels of IE1 RNA in lytically infected single pNSCs at 24 h p.i. were 57.6-fold higher (bold dashed line) than the limit of detection of the assay (light dashed line).

