
FIG 9.
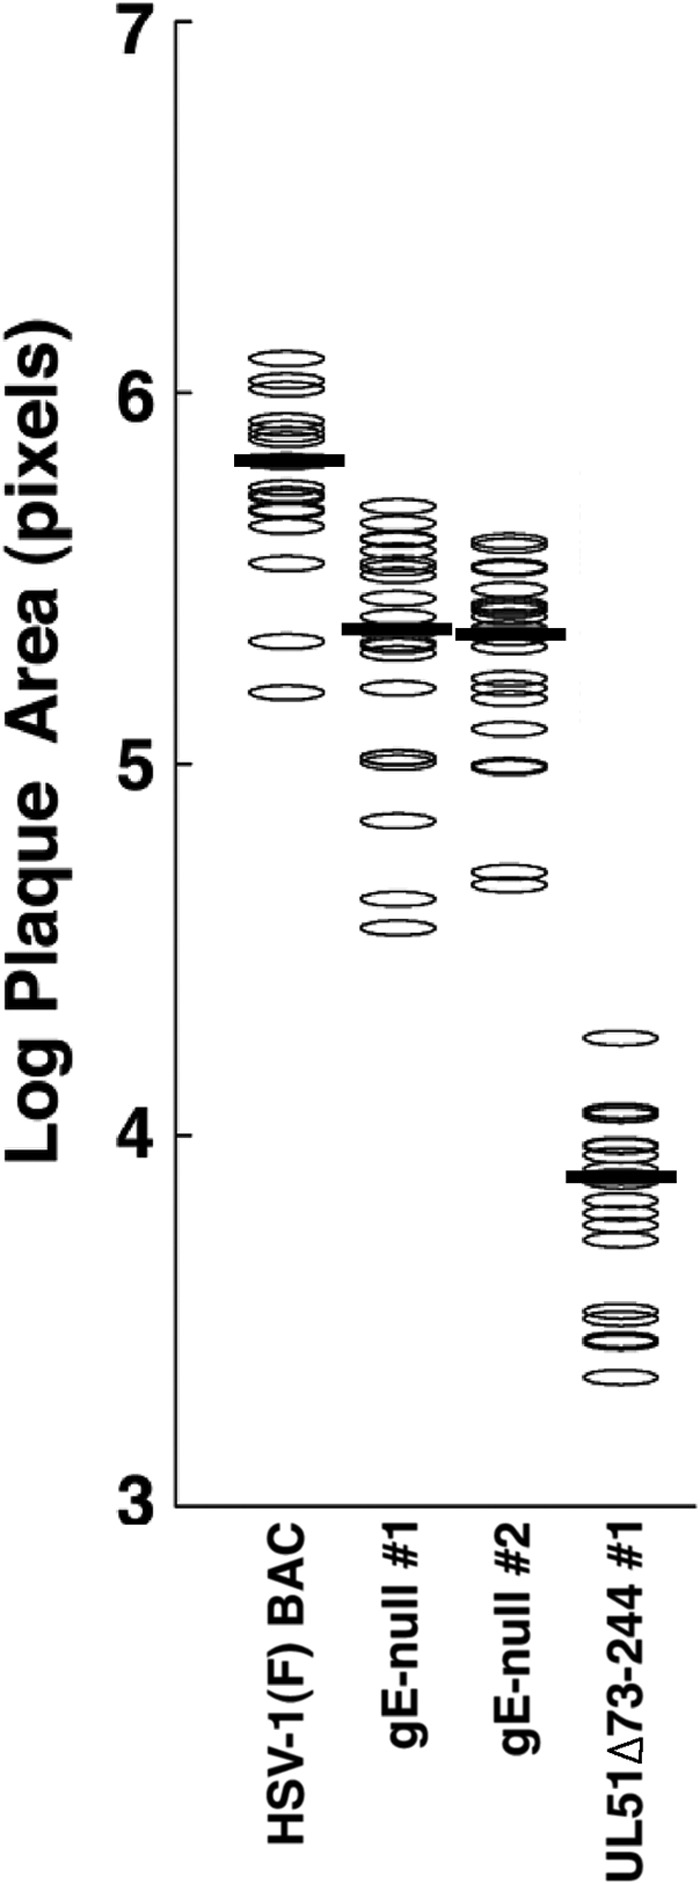
Comparison of spread phenotypes of gE and UL51 deletions. Plaques formed by each of the indicated viruses on Vero cells were measured and plotted as described in the legend of Fig. 2. Dark bars represent the median plaque size. The difference between the HSV-1(F) BAC and the gE-null viruses was significant, with a P value of <0.001.