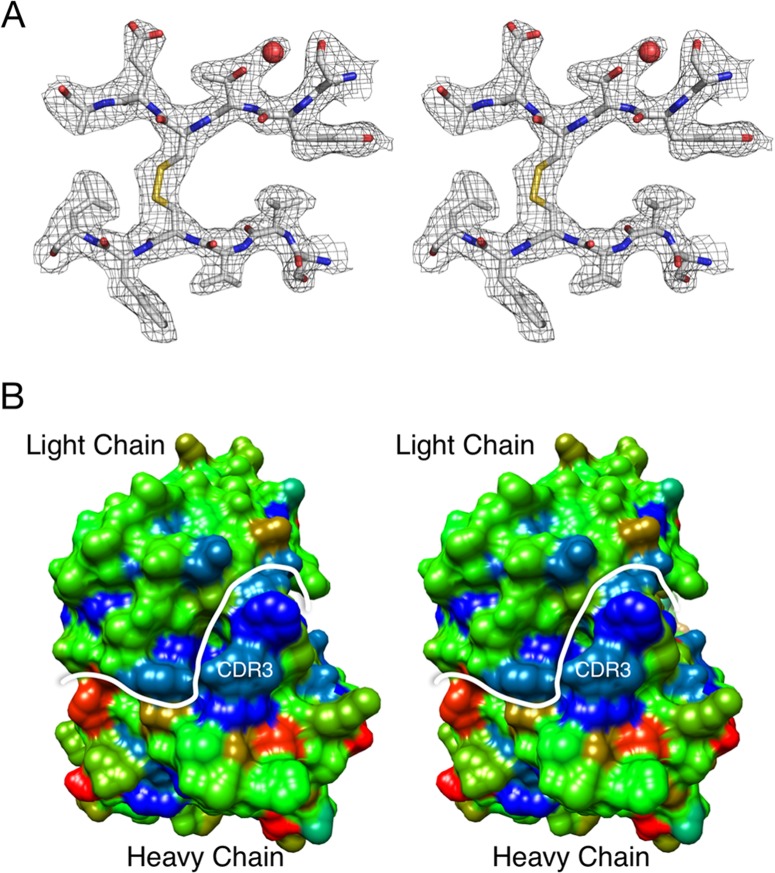
FIG 7.
Crystal structure of anti-MNV-1 Fab A6.2. (A) Shown here is a stereo diagram of a typical example of the final electron density of the refined structure of Fab A6.2 to an ∼2.5-Å resolution. The carbon, nitrogen, oxygen, and sulfur atoms are colored white, blue, red, and yellow, respectively. (B) In this stereo figure, the molecular surface of the Fab MAb A6.2 paratope is colored according to the hydrophobic index, ranging from blue for nonpolar to red for charged. The main chain atoms for the whole Fab were assigned a relatively neutral hydrophobicity index corresponding to the color green. The white line denotes the border between the heavy and light chains. The approximate location of the very hydrophobic CDR3 loop is also indicated.

