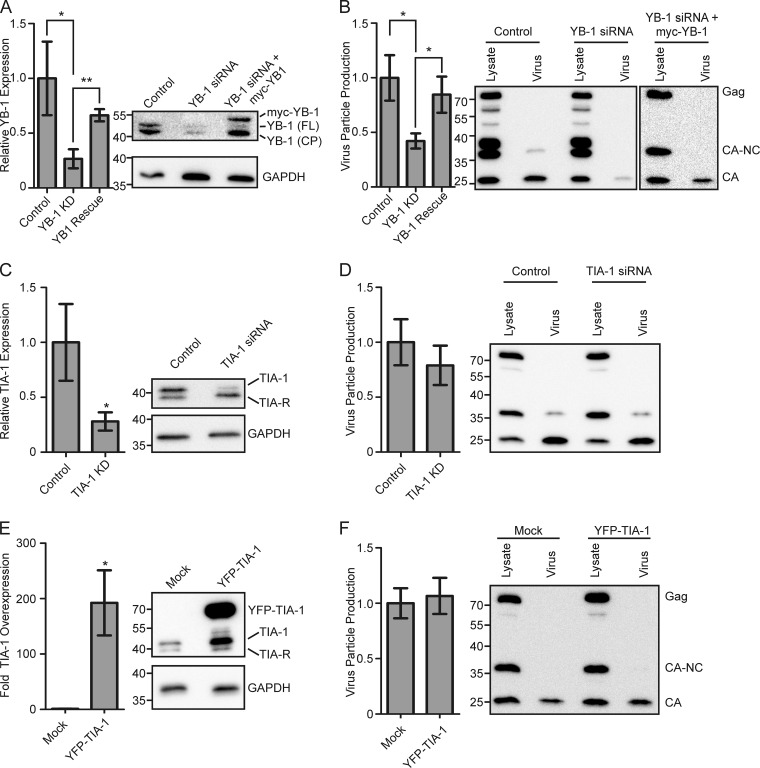
FIG 3.
Functional role of YB-1 in MMTV assembly. All graphs show the mean ± standard error of the mean calculated over at least four repetitions. Statistical significance (*, P < 0.05; **, P < 0.005) was determined by a two-tailed Student's t test (GraphPad Prism). (A) Graph showing mean relative YB-1 expression in NMuMG.C3H cells transfected with scrambled siRNA control, YB-1 siRNA (YB1 knockdown [KD]), or YB-1 siRNA and siRNA-resistant myc–YB-1 (YB1 Rescue). YB-1 expression was determined by Western blotting and standardized to the amount of GAPDH within each lane. YB-1 expression in cells treated with scrambled control siRNA was set to 100%. A representative Western blot is shown at right. YB-1 (FL) denotes full-length YB-1, while YB-1 (CP) is a previously described YB-1 cleavage product (61). Bands corresponding to YB-1 (FL) and myc–YB-1, but not YB-1 (CP), were quantitated, and results are shown in the graph. (B) Graph depicting virus production from cells used in the experiments described in panel A. Virus production was measured by quantitating the amount of Gag protein present in the medium (pelleted through a sucrose cushion) divided by the sum of the Gag protein present in the medium and lysates (amount in medium/amount in medium + amount in lysates) (2). A representative Western blot is shown to the right of the graph. Relative TIA-1 expression (C) and virus production (D) from NMuMG.C3H cells treated with TIA-1 siRNA or a control siRNA are shown. Western blots from representative experiments are shown to the right of the graphs. Overexpression of TIA-1 (E) and the effect on virus production (F) relative to cells transfected with a GFP control plasmid are shown. Representative Western blots are shown to the right of each graph.

