FIG 7.
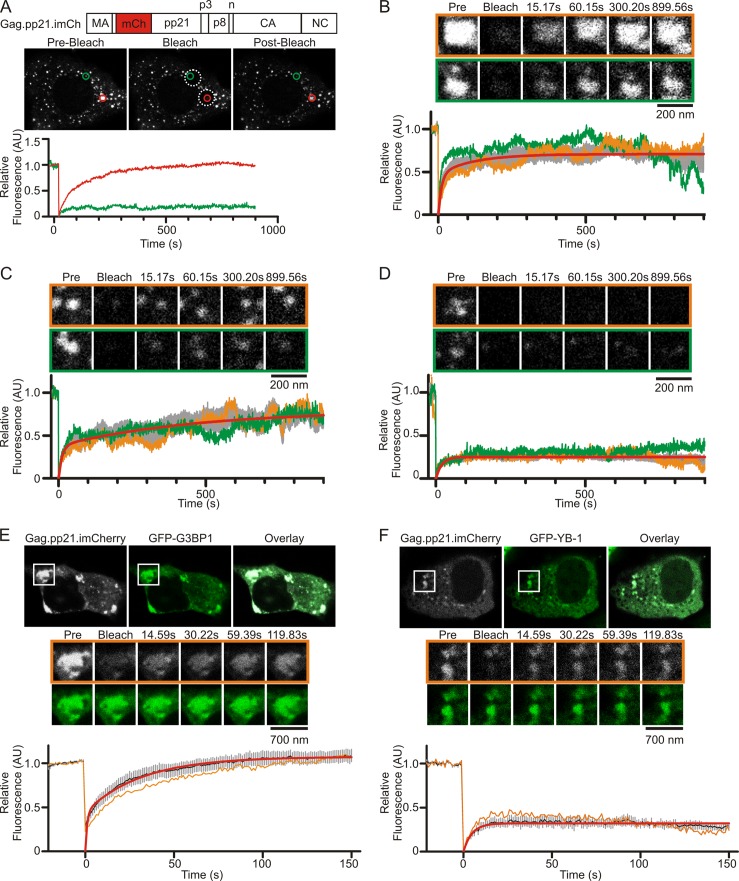
FRAP analysis of MMTV Gag in living MMTV(C3H)-infected cells. (A) Parameters used to define different populations of MMTV Gag complexes in living MMTV(C3H)-infected NMuMG cells. MMTV Gag was internally labeled with mCherry by inserting the fluorophore into the pp21 domain. The Gag.pp21.imCherry construct was expressed in NMuMG.C3H cells, and live cells were imaged by confocal microscopy. Individual foci were chosen for analysis, and the relative fluorescence of each focus was measured. Foci were monitored for 20 s (prebleach), subjected to photobleaching, and then monitored for fluorescence recovery for 15 min. The graphs show the relative fluorescence intensities of the foci indicated by the red and green circles. Analysis of 19 foci revealed discrete populations of foci with rapid (B), gradual (C), and limited (D) fluorescence recovery after photobleaching. Individual foci are shown in the orange and green boxes, with the relative fluorescence of each focus shown as the orange or green curve on the graph. The gray curves on each graph represent the mean fluorescence intensity from at least four foci ± standard errors of the means. The red line is the curve fit to the mean fluorescence intensity using GraphPad Prism using either a double (B and C) or single (D) exponential association curve. (E) FRAP analysis of Gag.pp21.imCherry within stress granules induced by expression of GFP-G3BP1 or GFP–YB-1 (F) in NMuMG.C3H cells. For each condition, a representative cell is shown at the initial prebleach time point, and a single cytoplasmic granule chosen for analysis is indicated by the white box. Enlarged images of the white boxed granule before (prebleach), during (bleach), and at various time points after photobleaching are shown for both the Gag.pp21.imCherry channel (grayscale, outlined by an orange line) and the GFP channel (green). Graphs show the mean fluorescence intensity for at least five granules (black line), with standard errors of the means (gray bars). The fluorescence intensity of the representative focus is show as an orange line. Red lines are curves fit to the averaged data with double (E) or single (F) exponential association equations using GraphPad Prism. Time is indicated in seconds (s). Pre, prebleach image. AU, arbitrary units.

