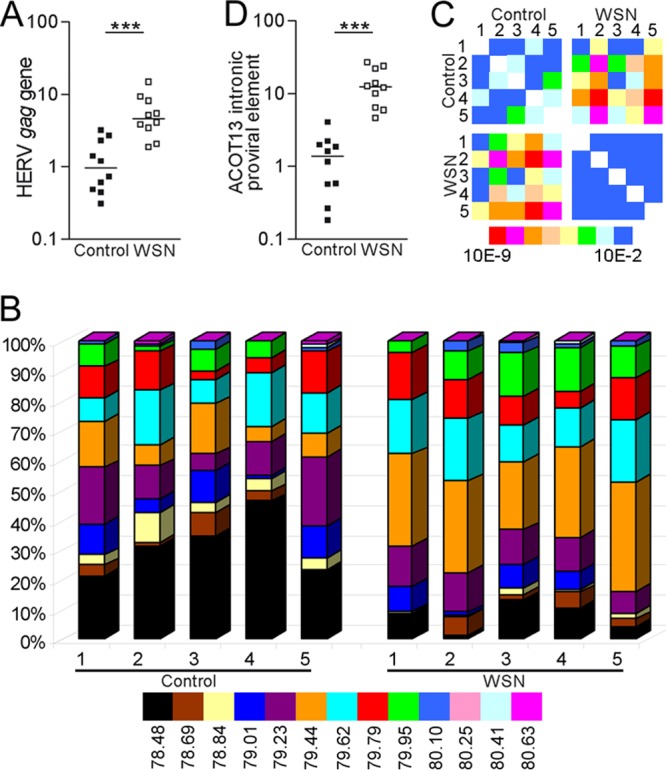
FIG 1.

Transcription of HERV-W elements in response to virus infection. (A and B) Relative levels (A) and frequency distributions of Tm categories (B) of transcripts containing the HERV-W gag sequence in uninfected human fibroblasts (control, n = 10) and in such cells 48 h after infection with influenza A/WSN/33 virus (WSN; n = 10) at an MOI of 0.5 (data for five pairs are shown in panel B). (C) Heat maps of P values obtained from chi-square analyses of the frequency distribution diagrams. Blue is considered not significant, with P being >0.01, and P values decrease as the color moves toward red (P < 10−9). (D) Relative levels of transcripts from the proviral HERV-W element integrated in an intron of ACOT13.
