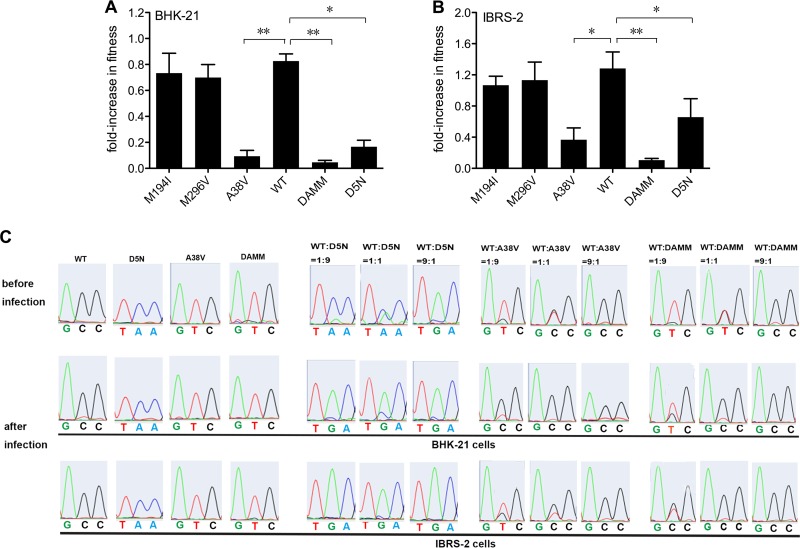
FIG 5.
Competition assays comparing the relative fitnesses of each mutant and the WT virus. (A and B) Indirect assays. Each virus was mixed at a 1:1 ratio with the marked competitor, which contained the PstI restriction site, and inoculated in triplicate into BHK-21 (A) or IBRS-2 (B) cells at an MOI of 0.1. The progeny RNA was RT-PCR amplified, and restriction fragment length polymorphism assays were performed to determine the abundance of each competitor. Fitness is represented as the output-to-input ratio of the FMDV 3Dpol R84H variant to the marked competitor. A fitness value of <1 indicates that the mutant or the WT is less fit than the marked competitor. The mean values ± standard deviations are shown (n = 3) (*, P < 0.05; **, P < 0.01 [determined by Student's t test]). (C) Direct assays. The D5N, A38V, or DAMM mutant was mixed with the WT at a ratio of 9:1, 1:1, or 1:9 and inoculated into BHK-21 or IBRS-2 cells at an MOI of 0.1 for 3 passages, after which the polymerase gene flanking position 5 or 38 was sequenced. The abundance of each competitor was measured as the height of the nucleotide encoding either the mutant (A or T nucleotide) or the WT (G or C nucleotide) in the sequencing chromatograms.

