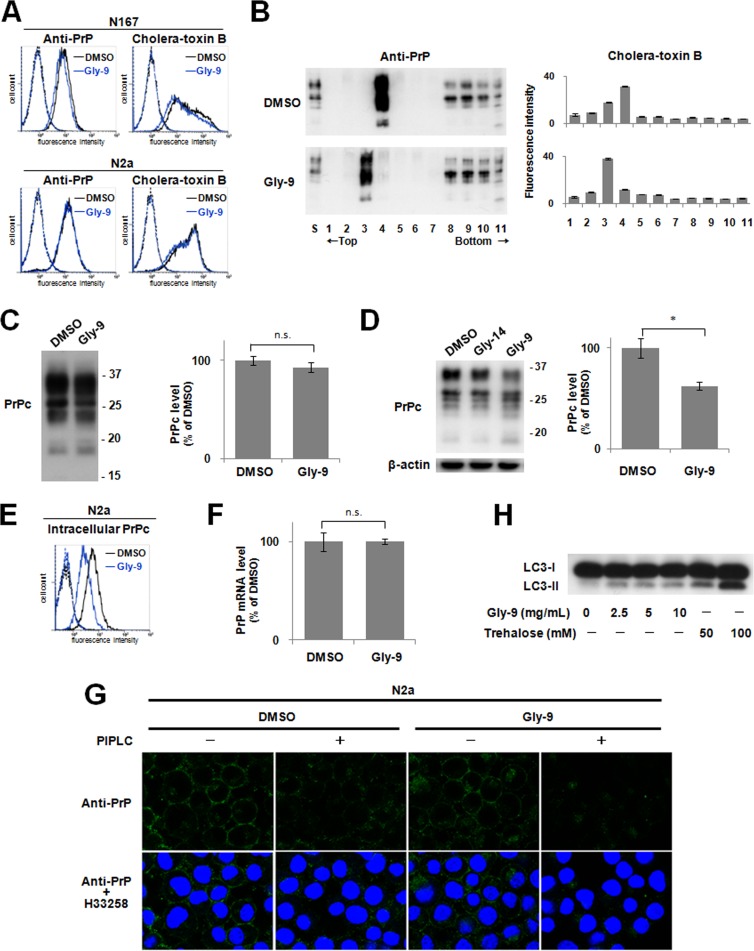
FIG 2.
Gly-9 effects on PrPc, lipid rafts, and autophagy. (A) Flow cytometry of cell surface PrP and lipid rafts in either Gly-9-treated N167 cells or Gly-9-treated uninfected N2a cells. Cells were treated with 5 μg/ml Gly-9 or its vehicle (DMSO) for 3 days. Cell surface PrP and lipid rafts were labeled with anti-PrP antibody and cholera toxin B, respectively. (B) Flotation assay of PrPc and lipid rafts in Gly-9-treated N2a cells. Cells were treated and analyzed as described for panel A. S, starting material. (C) Immunoblotting of lipid raft-associated PrPc in Gly-9-treated N2a cells. Cholera toxin B-positive lipid raft fractions from panel B were collected and analyzed for their PrPc levels. Molecular size markers on the right indicate sizes in kDa. Graphic data are averages and standard deviations for triplicate immunoblot signals (n.s., not significant). (D) Immunoblotting of total PrPc in Gly-9-treated N2a cells. A vehicle (DMSO)-treated cell sample and a Gly-14-treated cell sample are shown as controls. Cells were treated as described for panel A. Molecular size markers on the right indicate sizes in kDa. Graphic data are averages and standard deviations for triplicate immunoblot signals (*, P < 0.01). (E) Flow cytometry of intracellular PrPc in Gly-9-treated N2a cells. Cells were treated as described for panel A and were then digested with PIPLC. Cells were permeated with 0.1% Triton X-100 in PBS, and intracellular PrPc was labeled with anti-PrP antibody. (F) PrP mRNA level in Gly-9-treated N167 cells. Cells were treated as described for panel A. Data are averages and standard deviations for triplicate experiments (n.s., not significant). (G) Immunofluorescence of PrPc in Gly-9-treated N2a cells. Cells were treated as described for panel A for PIPLC “−” images and as described for panel E for PIPLC “+” images. Nuclei were stained with Hoechst 33258 (H33258). (H) Immunoblotting of autophagosome-related LC3-II in Gly-9-treated N167 cells. Cells were treated for 3 days with the indicated doses of Gly-9 or trehalose. Trehalose-treated cell samples are shown as positive controls.

