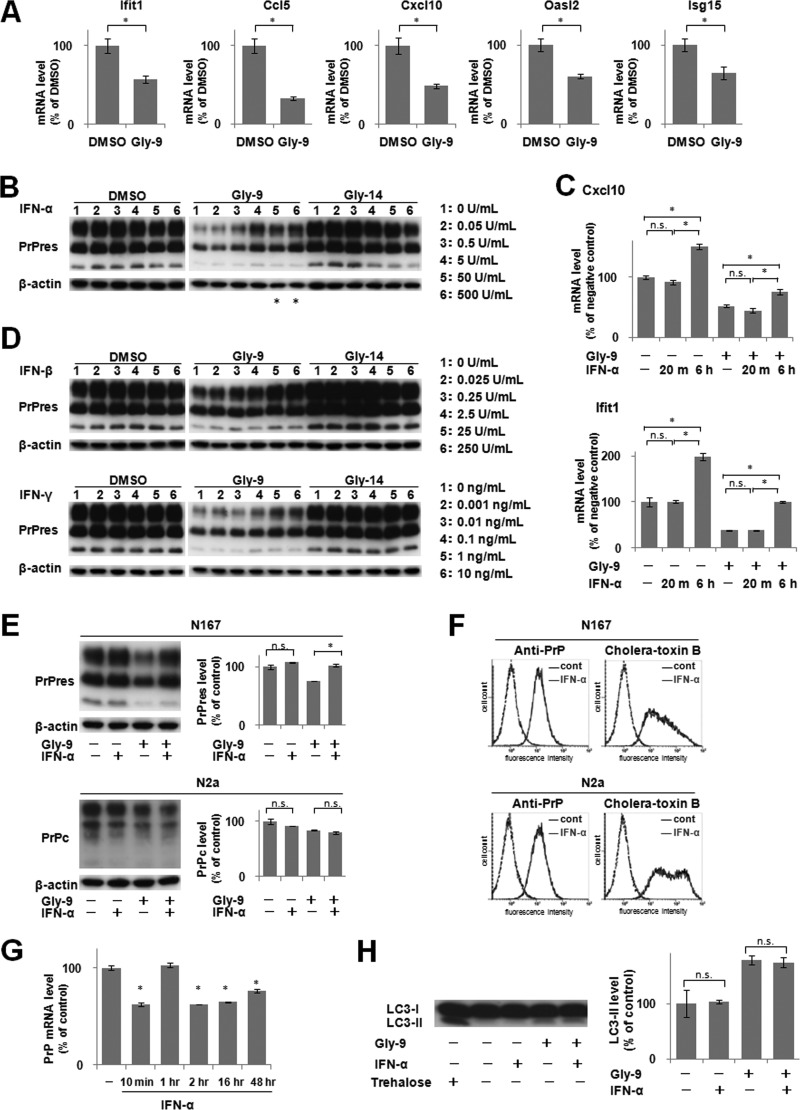
FIG 3.
Downregulation of IFN-stimulated genes and effects of IFN supplements. (A) mRNA levels of IFN-stimulated genes in Gly-9-treated N167 cells. Cells were treated with 5 μg/ml Gly-9 or its vehicle (DMSO) for 3 days. Data are averages and standard deviations for triplicate experimental results (*, P < 0.01). (B) Immunoblotting of PrPres in N167 cells treated with IFN-α. Cells in the presence of vehicle (DMSO), 5 μg/ml Gly-9, or 5 μg/ml Gly-14 were treated with the indicated doses of IFN-α for 3 days. The buffer volume and protein content in dosed IFN-α solutions were equilibrated using PBS and BSA. β-Actin signals are shown as controls for the integrity of samples used for PrPres detection. Asterisks denote cell toxicity observed at the designated doses. (C) Profiles of mRNA levels of representative IFN-stimulated genes in N167 cells treated with IFN-α in the presence or absence of Gly-9. The mRNA levels of Cxcl10 and Ifit1 were analyzed in cells that were treated with 5 μg/ml Gly-9 (Gly-9 +) or DMSO (Gly-9 −) for 3 days and, simultaneously, with 5 U/ml IFN-α for the indicated times before the harvest. For “IFN-α −” samples, cells were treated with BSA-containing PBS having amounts of buffer and protein equivalent to those in a 5-U/ml IFN-α solution for 6 h before harvesting. Data are averages and standard deviations for triplicate experimental results (*, P < 0.01; n.s., not significant). (D) Immunoblotting of PrPres in N167 cells treated with IFN-β or IFN-γ. Cells were treated with IFN-β or IFN-γ as described for panel B. As a buffer of the IFN-γ solution, 10 mM sodium phosphate (pH 8.0) was used instead of PBS. (E) Immunoblotting of PrPres in N167 cells and PrPc in N2a cells treated with Gly-9 and IFN-α. Cells were treated with combinations of 5 μg/ml Gly-9 and 5 U/ml IFN-α for 3 days. Each vehicle was used as a negative control. Graphic data are averages and standard deviations for triplicate immunoblot signals (n.s., not significant; *, P < 0.01). (F) Flow cytometry of cell surface PrP and lipid rafts in N167 cells and N2a cells treated with IFN-α. Cells in the presence of 5 μg/ml Gly-9 were treated with 5 U/ml IFN-α or its vehicle (cont) for 3 days. Cell surface PrP (anti-PrP) and lipid rafts (cholera-toxin B) were labeled as described already. (G) PrP mRNA levels in N167 cells treated with IFN-α. Cells were treated with 5 μg/ml Gly-9 for 3 days and, simultaneously, with 5 U/ml IFN-α for the indicated periods before the harvest. Data are averages and standard deviations for triplicate experimental results (*, P < 0.01 versus vehicle control). (H) Immunoblotting of autophagosome-related LC3-II in N167 cells treated with Gly-9 and IFN-α. Cells were treated with combinations of 5 μg/ml Gly-9 and 5 U/ml IFN-α for 3 days. Treatment with 100 mM trehalose is shown as a positive control. Each vehicle was used as a negative control. Graphic data represent averages and standard deviations for triplicate immunoblot signals (n.s., not significant).

