
FIG 3.
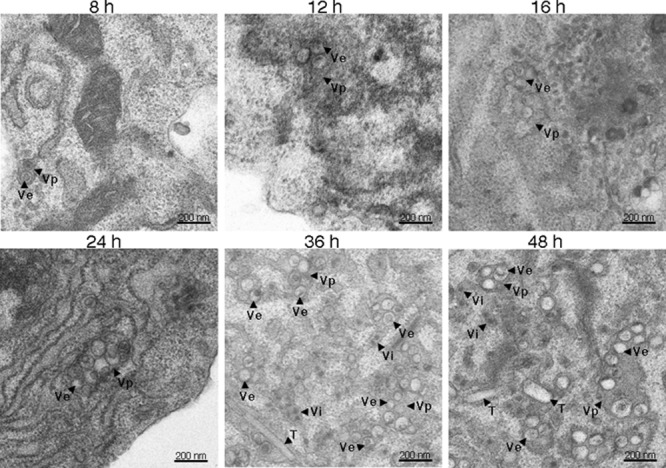
Progression of DENV-induced ultrastructure alterations. Electron micrographs representing chemically fixed DENV-infected cells at 8 h (A), 12 h (B), 16 h (C), 24 h (D), 36 h (E), and 48 h (F) after infection are shown. A minimum of 50 cells was examined for morphological changes that occur during DENV infection of C6/36 cells. An image of each representative area is shown. The Vp and Ve structures were first observed at 8 h p.i. (A). Minimal expansion in the numbers of these structures was observed at 12 p.i. (B) and 16 h p.i. (C). A significant expansion of Vp and Ve formation was observed at 24 h p.i. (D). The T were visualized only at 36 h p.i. (E), with the presence of Vp and Ve structures occupying a significant volume of infected cells. Scale bars, 200 nm.