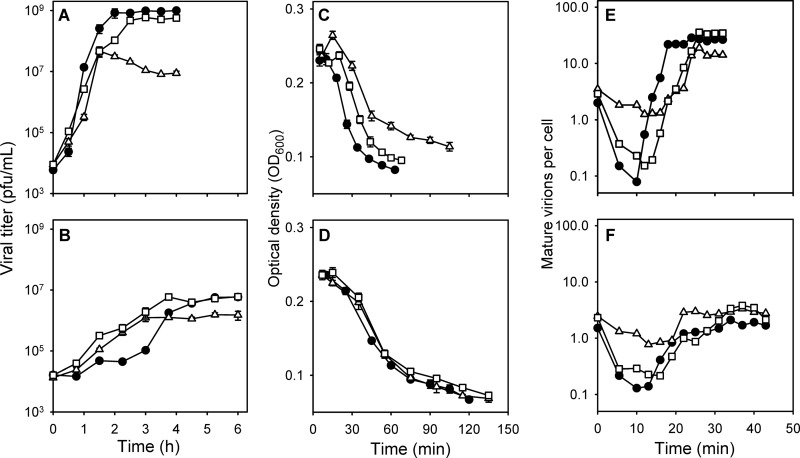
FIG 2.
Effect of the V2A and D8A substitutions on lytic and growth properties of the virus. Standard growth curves (A and B), lysis assays (C and D), and intracellular growth assays (E and F) are shown for the WT (black circles), V2A (white squares), and D8A (white triangles) viruses in the absence (A, C, and E) and in the presence (B, D, and F) of 10 ng/μl 5-FU. Error bars in panels A to D indicate the standard errors of the means (SEM) and are not shown in panels E and F for clarity.

