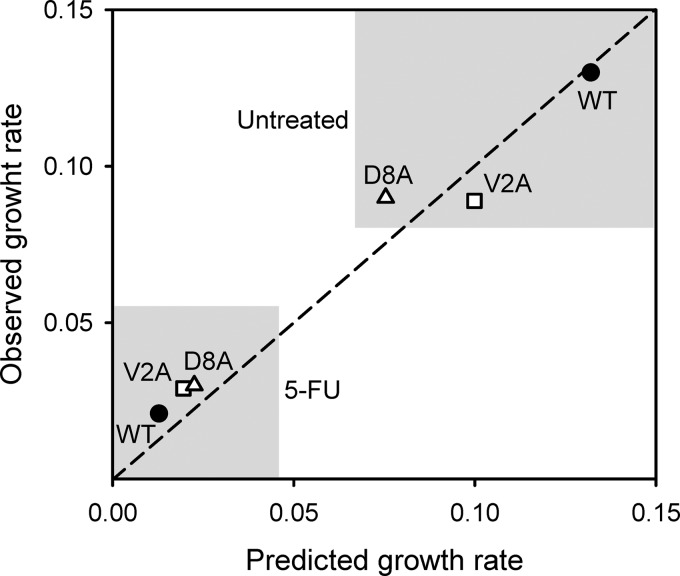
FIG 3.
Expected effect of changes in lysis time and burst size on viral growth rate. The growth rates of the WT (black circles), V2A (white squares), and D8A (white triangles) viruses were predicted based on their experimentally determined lysis times and burst sizes (x axis) and compared to measured growth rates (y axis) in the presence and in the absence of 10 ng/μl 5-FU.

