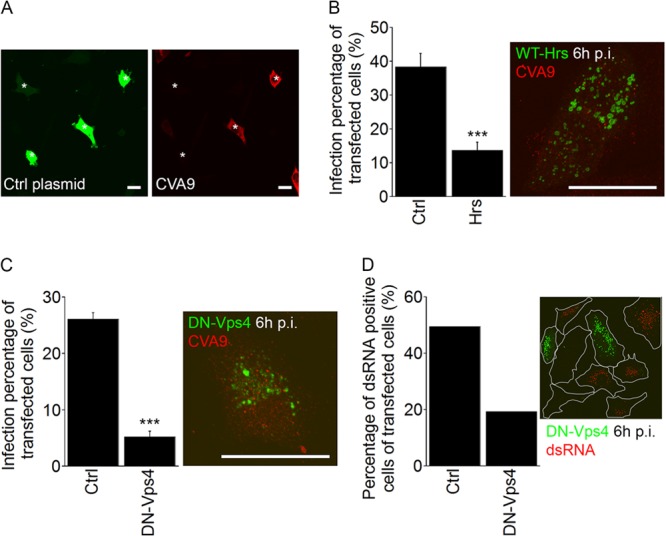
FIG 6.

The ESCRT complex is needed for successful CVA9 infection. (A) Fluorescent images of GFP-transfected cells (Ctrl plasmid, green) and CVA9-infected cells (red) at 6 h p.i. The asterisks represent transfected cells. Bars, 30 μm. (B) A549 cells were transfected with a wild-type plasmid of Hrs (Hrs-WT–GFP; Hrs in the chart) or the control GFP construct (Ctrl). After 48 h for expression, cells were infected with CVA9, and the infection percentages (cells producing CVA9 capsid protein 6 h p.i.) of transfected cells were quantified 6 h p.i. The results are mean values of two independent experiments (± standard errors [SE]), and statistical significance was calculated with a paired-sample t test (after arcsine square root transformation). ***, P < 0.001. In the maximum intensity projection of confocal sections (time point, 6 h p.i.), the Hrs-WT–GFP was visualized in green and CVA9 was visualized in red. Bar, 30 μm. (C) The dominant negative mutant of Vps4 (VPS4-E235Q–GFP; DN-Vps4 in the chart) and the control GFP construct (Ctrl) were transfected in cells. Sample preparation and analysis were performed as described for Fig. 6B. The results are mean values of two independent experiments (± SE), and statistical significance was calculated with a paired-sample t test (after arcsine square root transformation). ***, P < 0.001. Maximum intensity projection of confocal sections of a cell expressing VPS4-E235Q–GFP (DN-VPS4, green) at 6 h p.i. CVA9 is shown in red. Bar, 30 μm. (D) The transfection was performed as for panel C. After CVA9 infection (6 h), the samples were labeled with anti-dsRNA antibody, and the percentages of dsRNA-positive cells within the transfected cells were calculated. In both cases, more than 50 cells were quantified.
