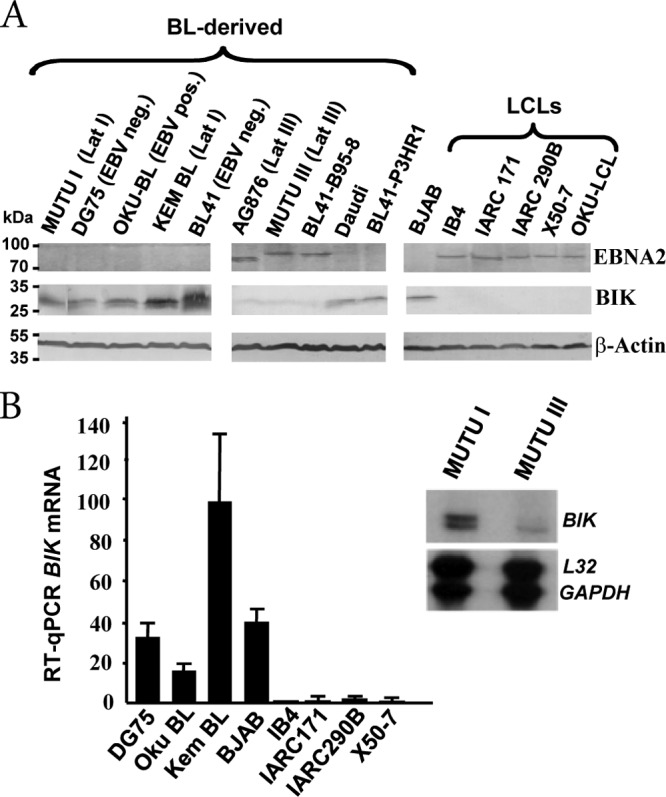
FIG 1.

Expression of BIK in a panel of lymphoma-derived B-cell lines and LCLs. (A) Western blot analysis showing EBNA2, BIK, and β-actin levels, indicated to the right of each panel. The EBV and Lat program status for each BL-derived cell line is given in brackets. OKU-BL is EBV positive and exhibits a Wp-restricted latency gene expression pattern in which EBNA2 is not expressed. BL41-B95-8 is a subclone of BL41 that was infected with the EBV B95-8 strain and expresses EBNA2; Daudi and BL41-P3HR1 are EBV-positive EBNA2 deletion-containing cell lines. BJAB is a non-BL EBV-negative B-lymphoma cell line. AG876 expresses type II EBNA2, which has a lower molecular weight than type I EBNA2. (B) Comparative BIK mRNA levels in a panel of B-cell lines. The bar graph shows RT-qPCR data. Relative BIK transcript levels were determined after coamplification and normalization to GAPDH transcript levels. The image on the right is of an RNase protection assay (RPA) autoradiogram and shows comparative BIK, L32, and GAPDH transcript levels in the isogenic EBV-positive BLs MUTU I (Lat I) and MUTU III (Lat III).
