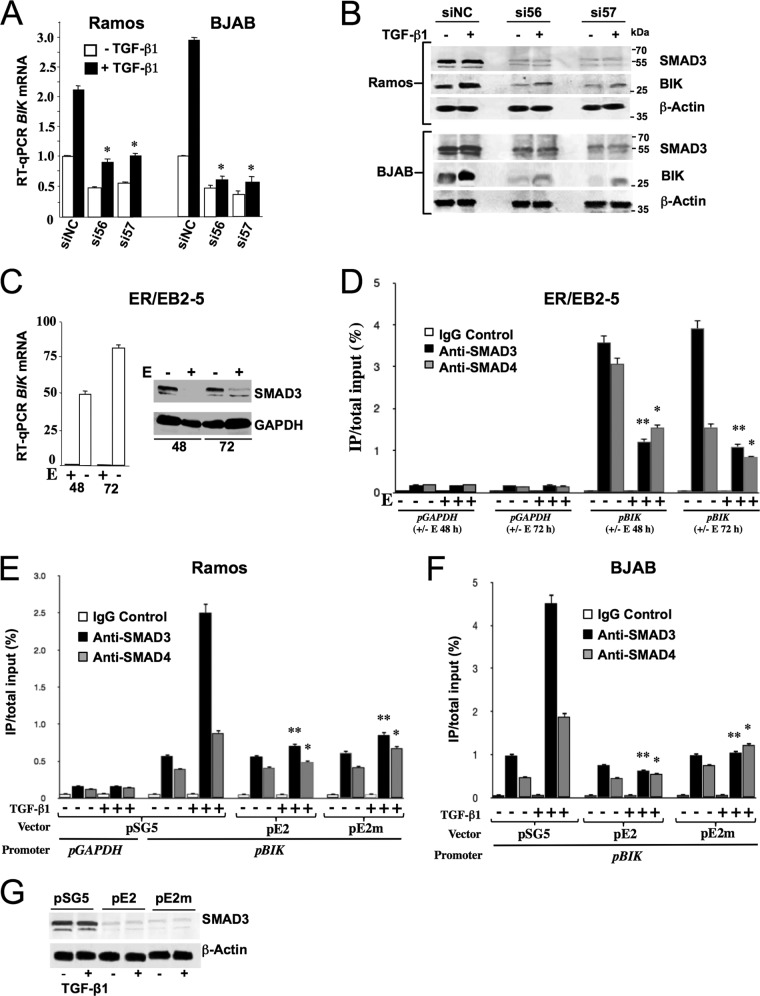
FIG 5.
R-SMADs are key regulators of BIK and are modulated by EBV Lat III in a conditional LCL and by ectopic EBNA2 in EBV-negative B cells. (A) Ramos and BJAB were transfected with anti-SMAD3 siRNAs (siRNA56 and siRNA57) and nonspecific control siRNA (siNC). Twenty-four hours later, cells were treated with either 10 ng/ml of TGF-β1 or vehicle for a further 4 h, harvested, and analyzed by RT-qPCR for BIK mRNA levels. The BIK transcript level in siNC-transfected/−TGF-β1 cells was set to 1, and other values are presented relative to that. The statistical comparisons shown were made with the BIK transcript level in the corresponding siNC-transfected TGF-β-treated control. Data are means ± standard deviations. *, P ≤ 0.05. (B) Western blotting for SMAD3, BIK, and β-actin using protein extracts from the same experiment as shown in panel A. (C) LCL ER/EB2-5 cells were cultured in the presence or absence of β-estradiol (E + and −) and harvested for total RNA and protein 48 and 72 h later (values indicated underneath). Shown are RT-qPCR results for BIK mRNA (graph on left) and Western blot analysis results for SMAD3 (image on right). (D) ChIP analysis showing the relative SMAD3 and SMAD4 levels bound to the endogenous BIK promoter. Samples of sonicated chromatin were prepared from ER/EB2-5 cells that had been cultured with or without β-estradiol (E) for both 48 and 72 h (+ or − E) (values underneath the graph). These were then incubated separately with anti-SMAD3, anti-SMAD4, or isotype control antibody (control IgG). Input DNA and DNA isolated from immune-precipitated material (target-enriched DNA or isotype control-enriched DNA) were amplified by qPCR with primers designed to amplify a 420-bp SBE-containing sequence from the BIK promoter (pBIK). An irrelevant target DNA sequence (from the GAPDH promoter; pGAPDH) was also amplified independently from the same samples. Levels of promoter-bound SMAD3 and SMAD4 are expressed as percentages of the total input. Statistical comparisons were made between β-estradiol-treated or untreated samples taken at the same time points. The data shown were compiled from three experiments. Means ± standard deviations are shown. *, P ≤ 0.05, **, P = 0.001 to 0.01. (E and F) ChIP analysis results, showing the relative SMAD3 and SMAD4 levels bound to the endogenous BIK promoter in Ramos (E) and BJAB (F) following transfection with effector plasmids (samples bracketed together underneath each graph) and treatment with TGF-β1. Forty-eight hours after transfection, cells were treated with or without 10 ng/ml TGF-β1 for a duration of 4 h. Cells were then harvested, and ChIP was performed as described for panel D, targeting the same regions of the BIK and GAPDH promoters. Levels of promoter-bound SMAD3 and SMAD4 are expressed as percentages of the total input. Statistical comparisons were made relative to the corresponding pSG-transfected/TGF-β1-treated samples. The data shown were compiled from three experiments. Values are means ± standard deviations. *, P ≤ 0.05; **, P = 0.001 to 0.01. (G) Western blotting results, showing endogenous SMAD3 levels in BJAB cells 48 h after transfection with effector plasmids (names given above each lane) and treatment with or without TGF-β1 at 10 ng/ml (+ and − underneath the blots).

