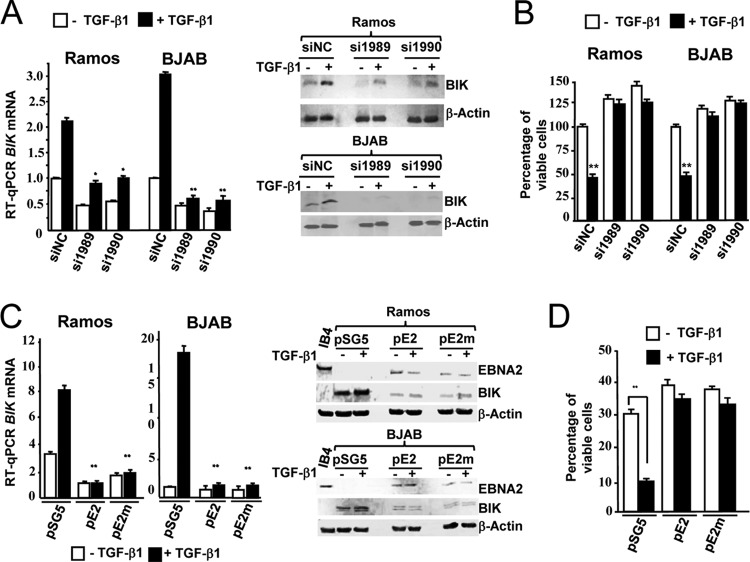
FIG 7.
Transient BIK knockdown and ectopic EBNA2 antagonize TGF-β1-induced apoptosis. (A) Ramos and BJAB cells were transfected with anti-BIK siRNAs (si1989 and si1990) and negative control siRNA (siNC) and then either treated with TGF-β1 (10 ng/ml) or vehicle. Relative BIK mRNA and BIK protein levels were determined 24 h later by RT-qPCR (graph on left) and Western blotting (image on right). Fold differences were calculated relative to the siNC-transfected control (assigned a value of 1). RT-qPCR data are means ± standard deviations. *, P ≤ 0.05; **, P = 0.001 to 0.01; statistical comparisons were made between each effector siRNA (+TGF-β1) and TGF-β1-treated siNC. (B) Survival profiles from cells transfected and treated as described for panel A were determined by double-staining with Annexin V/7-AAD followed by FACS. The bar chart shows the percentages of viable cells. The percentage of viable cells following transfection with siNC was set to 100%, and other values are presented relative to that. BIK knockdown with si1989 and si1990 (in the absence of TGF-β1) reduced the extent of cell death associated with the transfection procedure itself. Data are means ± standard deviations. **, P = 0.001 to 0.01. (C) Ramos and BJAB cells were transfected with 1 μg of pSG5, pEBNA2 (pE2), or pSGEBNA2WW323SR (pE2m). Forty-eight hours later, cells were treated with TGF-β1 (10 ng/ml) and relative BIK mRNA levels were determined 24 h later by RT-qPCR (bar charts on left). Data are means ± standard deviations. **, P = 0.001 to 0.01. The corresponding EBNA2, BIK, and β-actin protein levels were also determined by Western blotting (panels on right). The effector plasmids used for transfection and the presence/absence of TGF-β1 (+/−) are indicated above each lane. Protein extract from IB4 cells (not treated with TGF-β1) was loaded as a control for EBNA2 expression. (D) Survival profiles of Ramos cells that were transfected and treated as described for panel C were obtained by double-staining with Annexin V/7-AAD followed by FACS. The bar chart shows the percentages of viable cells. Data are means ± standard deviations. **, P = 0.001 to 0.01.

